
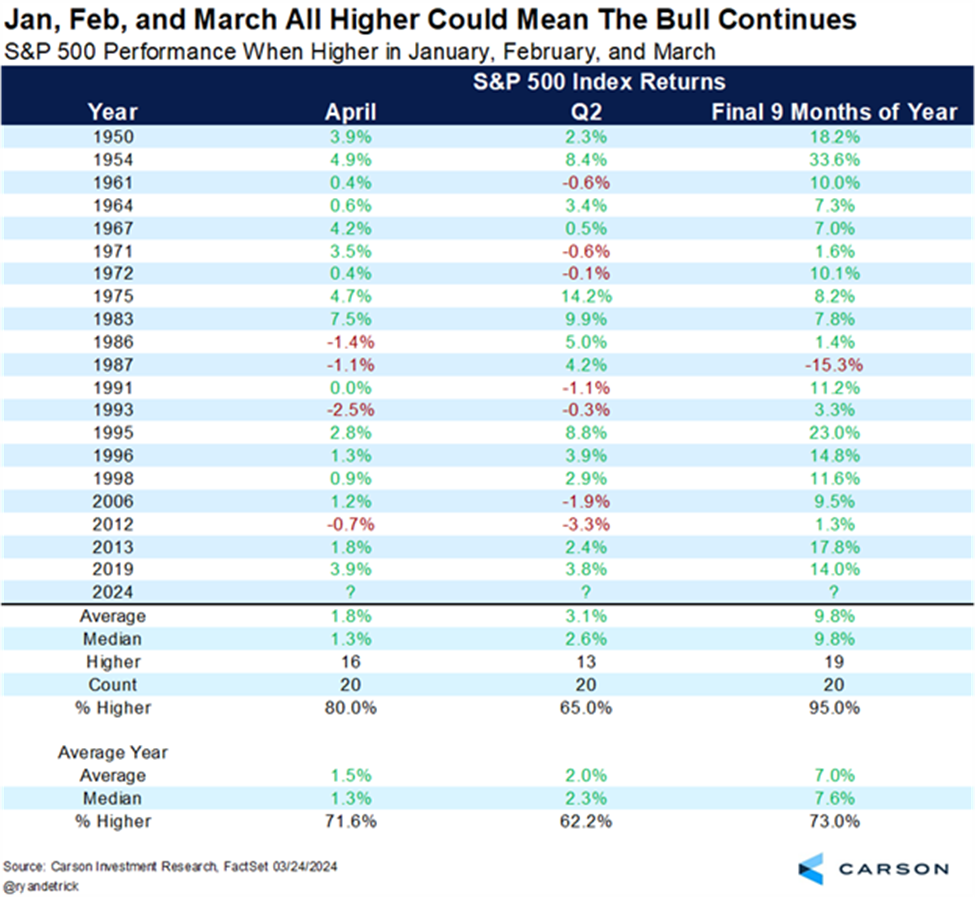
The year has kicked off impressively for the wider markets. Both major indices, spanning across borders, have hit record peaks, setting optimistic tones for the months ahead. A strong beginning often forecasts sustained growth for the subsequent nine months. What’s noteworthy is that a robust start often translates into April also delivering impressive results. For instance, in instances where stocks surge in the first quarter, April tends to outperform with an average gain of 1.8%, surpassing the typical April increase of 1.5%.
Economic Indicators – Conference Board
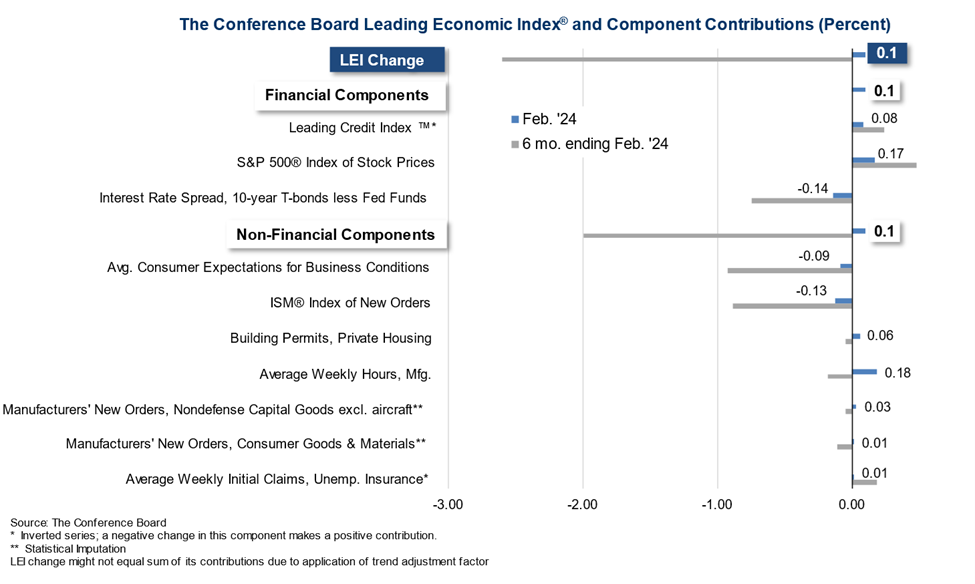
On the previous Thursday, the Conference Board released its updated Leading Economic Index (LEI) utilizing February data. Following 23 consecutive months of month-over-month declines, the LEI finally saw a slight uptick, albeit by the narrowest of margins, with a gain of 0.1%.
But what exactly do economic indicators entail and why do they hold significance?
The Leading Economic Index (LEI) serves as an early signal for significant shifts in the business cycle, offering insights into the near-term direction of the economy. Conversely, the Coincident Economic Index (CEI) provides a snapshot of the current economic state. Meanwhile, the Lagging Economic Index (LAG) is anticipatory, signaling changes ahead of the broader economy. Lagging economic indicators play a confirmatory role. Once released, they validate what leading indicators may have already suggested, removing uncertainties.
In February 2024, the Conference Board Coincident Economic Index® (CEI) for the U.S. increased by 0.2 percent to reach 112.3 (2016=100), following a 0.1 percent uptick in January. Over the six-month period ending in February 2024, the CEI saw a 1.1 percent rise, compared to the 0.8 percent increase observed in the previous six months. The CEI incorporates key indicators such as payroll employment, personal income excluding transfer payments, manufacturing and trade sales, and industrial production, which are used to gauge recessions in the U.S. All four components of the index displayed positive trends last month, with personal income excluding transfer payments and payroll employment making the most significant contributions to the Index.
In the same period, the Conference Board Lagging Economic Index® (LAG) for the U.S. increased by 0.3 percent, reaching 118.8 (2016 = 100), following a similar 0.3 percent rise in January. The LAG has seen a growth of 0.8 percent over the six-month period spanning from August 2023 to February 2024, contrasting with no growth recorded over the preceding six months.
Earnings Expectations
The current environment, marked by elevated interest rates and a broader economic policy tightening, has stirred market concerns for months regarding a potential economic slowdown or recession. The question revolves around whether analysts have adjusted earnings per share (EPS) estimates more drastically than usual for S&P 500 companies in the first quarter. The answer is no.
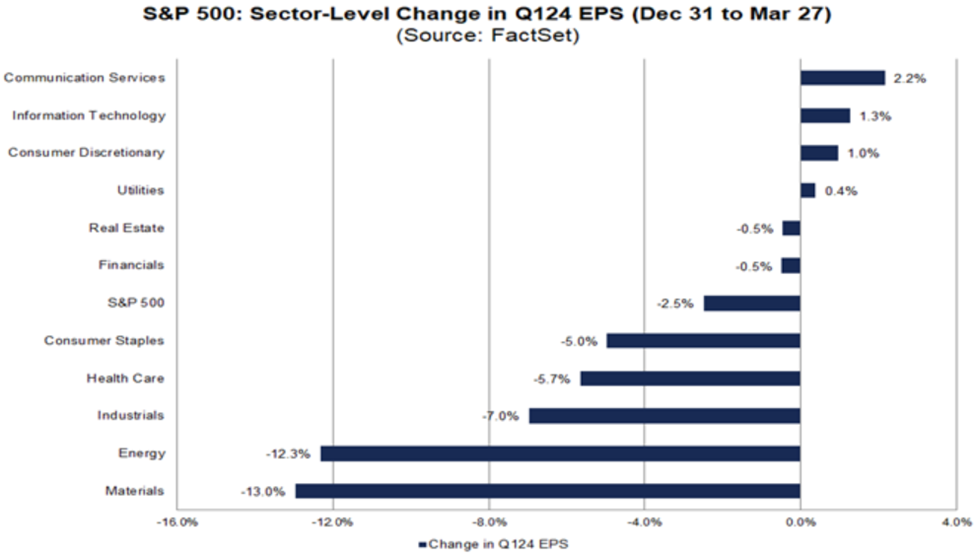
Throughout the first quarter, analysts moderated EPS estimates for the period by a lesser degree compared to the norm. The first quarter’s bottom-up EPS estimate, derived from the median EPS estimates for all companies within the index, experienced a 2.5% decrease (falling from $56.34 to $54.94) from December 31 to March 27.
Typically, analysts tend to revise earnings estimates downwards over the course of a quarter. Over the past five years, encompassing 20 quarters, the average reduction in the bottom-up EPS estimate during a quarter stands at 3.7%. Below is a detailed breakdown of sectors witnessing significant adjustments, whether positive or negative.
Revival in Canadian Banking Sector!
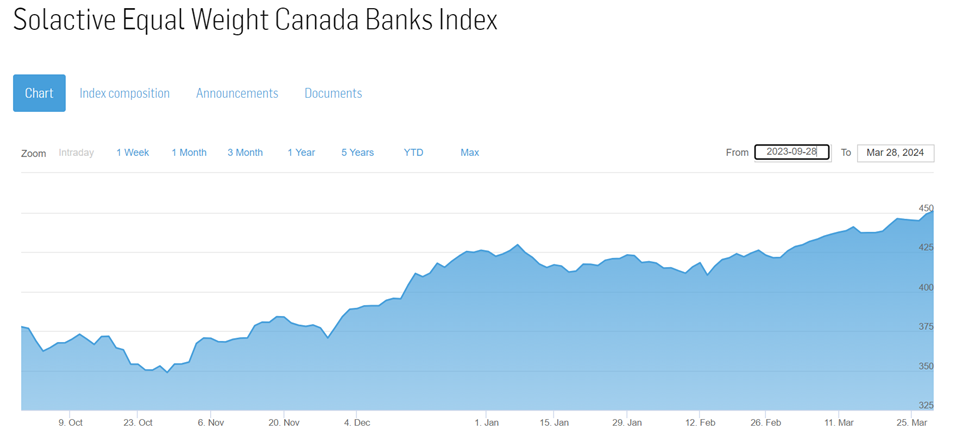
Over the past two years, Canada’s leading banks have encountered numerous challenges. From dwindling earnings in their wealth management divisions to significantly higher loan loss provisions, these traditionally robust institutions have seen their valuations plummet by as much as 35% over recent quarters. However, there appears to be a resurgence of interest among investors in these iconic institutions. In recent months, there has been a noticeable uptick in their stock prices accompanied by increased trading volumes. These emerging trends coincide with the TSX Composite reaching record highs last week, a momentum many anticipate will persist despite the possibility of a deferred interest rate cut in Canada.
Further Resilience in Canada
The Canadian economy exhibited unexpected strength in January, surpassing analysts’ expectations with its most robust monthly growth in a year. Economists suggest that this positive outcome could prompt heightened vigilance from the Bank of Canada. According to Statistics Canada, real gross domestic product (GDP), a metric gauging the value of goods and services produced within a specific timeframe, increased by 0.6 percent in January. This exceeded analysts’ projections of 0.4 percent. Additionally, the agency anticipates a 0.4 percent uptick in GDP for February.
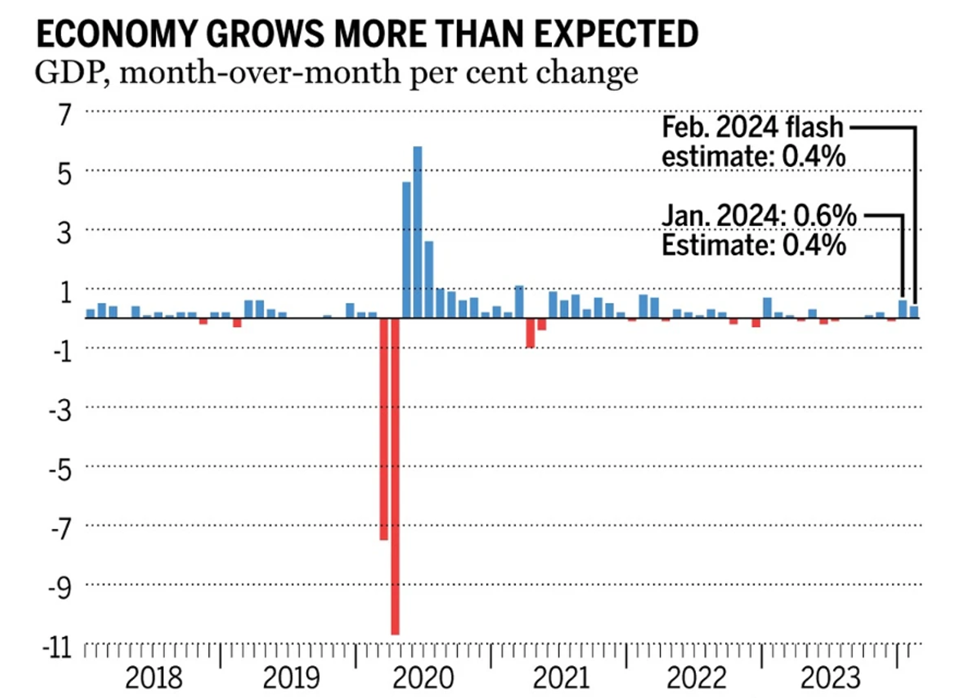
“To put that two-month flurry of growth into perspective, the combined one per cent gain is as much as the economy grew in the entire 12 months of 2023,” Bank of Montreal chief economist Douglas Porter said in a note. “After a prolonged lull through much of last year … the economy looks to have caught some strong tailwinds early this year.” (Source: Financial Post)
Canada’s Inflation Trends
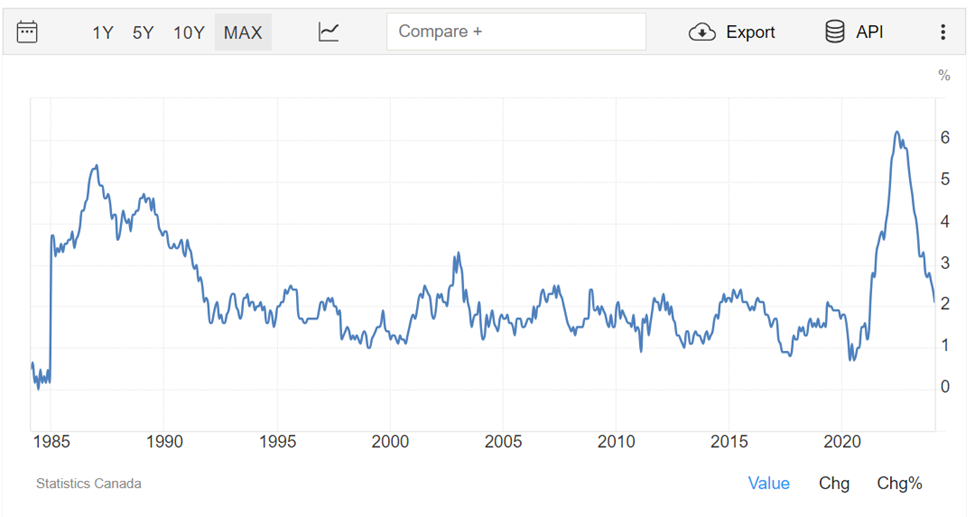
In February 2024, Canada’s annual inflation rate continued its deceleration, easing to 2.8% from 2.9% in January 2024, marking the lowest level since June 2023. This outcome diverged from market expectations of 3.1%, providing the Bank of Canada with additional room to consider monetary loosening in the latter part of the year. Notably, significant declines were observed in the costs of cellular services (-26.5%) and Internet access services (-13.2%). Conversely, inflation moderated for food (3.3% vs. 3.9% in the previous month), primarily due to reduced grocery prices. Conversely, gasoline prices rebounded (0.8% vs. -4%), driven by elevated global crude oil costs stemming from anticipated extensions of production cuts. Additionally, escalating bond yields led to increases in mortgage rates and shelter prices (6.5% vs. 6.2%).
Core Inflation Highlights
In Canada, the core inflation rate serves as a measure of price changes for a basket of goods, excluding eight of the most volatile components identified by the Bank of Canada. These exclusions encompass fruit, fruit preparations, and nuts; vegetables and vegetable preparations; mortgage interest costs; natural gas; fuel oil and other fuels; gasoline; inter-city transportation; and tobacco products and smokers’ supplies. Moreover, it excludes the impact of changes in indirect taxes.
US Inflation Trends
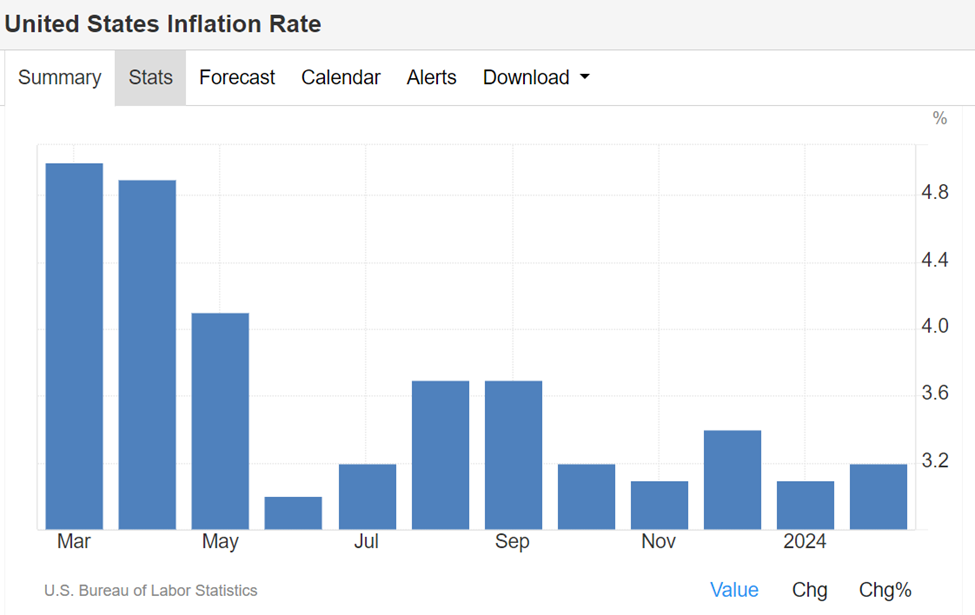
In February 2024, the annual inflation rate in the US unexpectedly rose to 3.2%, up from 3.1% in January, surpassing forecasts of 3.1%. Energy costs experienced a lesser decline than anticipated, decreasing by 1.9% compared to 4.6% in January. Gasoline prices dropped by 3.9% (versus -6.4%), utility gas service decreased by 8.8% (versus -17.8%), and fuel oil went down by 5.4% (versus -14.2%). Conversely, the pace of price increases slowed for food (2.2% versus 2.6%), shelter (5.7% versus 6%), and new vehicles (0.4% versus 0.7%). This is yet another reason we believe the timeline for interest rate cuts will continue to get pushed back.
In Summary
The bullish momentum of 2024 persisted throughout March. Both the TSX Composite and the S&P 500 soared to record highs despite the postponement of interest rate cuts. The economy’s resilience, gauged by GDP and unemployment metrics, has alleviated pressure on central banks to implement rate reductions. Nonetheless, the stock market appears content with prevailing conditions, buoyed by indications of growth in earnings and other leading economic indicators. Although the timeline for interest rate cuts has been deferred, it’s likely they will occur at some point in 2024. This represents a potent tool at the disposal of central banks in the event of a slowdown or unforeseen risks. Such prospects bode well for both equity and fixed income markets, positioning favorably for investors.
We thank you for your continued trust and we welcome you to reach out to us with any questions you may have.
This information has been prepared by Kian Ghanei and Terry Fay who are Portfolio Managers for iA Private Wealth Inc. and does not necessarily reflect the opinion of iA Private Wealth. The information contained in this newsletter comes from sources we believe reliable, but we cannot guarantee its accuracy or reliability. The opinions expressed are based on an analysis and interpretation dating from the date of publication and are subject to change without notice. Furthermore, they do not constitute an offer or solicitation to buy or sell any of the securities mentioned. The information contained herein may not apply to all types of investors. The [Investment Advisor/Portfolio Manager] can open accounts only in the provinces in which they are registered.
iA Private Wealth Inc. is a member of the Canadian Investor Protection Fund and the Investment Industry Regulatory Organization of Canada. iA Private Wealth is a trademark and business name under which iA Private Wealth Inc. operates.