
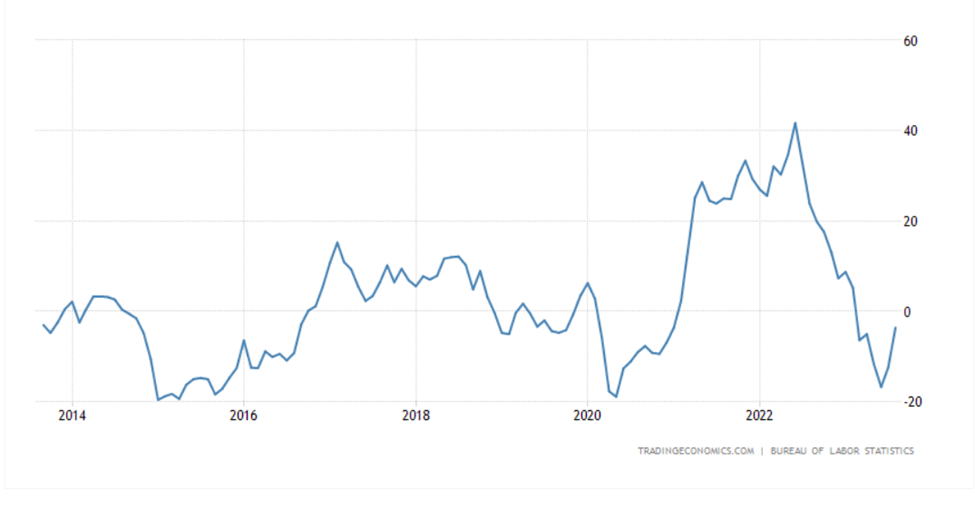
As far as the markets are concerned, the last two months have been less than jovial. We have seen headline inflation get worse as exemplified by the prices at the pump. Canada and the US remain to be one of the leading petroleum producers in the world but on a global scale, OPEC still weighs heavy on prices by controlling production which has taken away some of our momentum over the last few months. As frustrating as this is, it is a reality that plays into our everyday lives. Energy costs are a huge factor in inflation, and it creates prices instability in assets and volatility in the stock market. Although energy prices had been falling over the last year or so, they have moved higher over the last 3 month causing some concern. (Source: Trading Economics)
Inflation data is difficult to obtain and there are difference methods in collection and analysis of them. Lately, there have been some concerns with headline CPI inflation data, but on the flip side, there have been areas of encouragement when looking at Core PCE inflation data and the most recent University of Michigan inflation expectations surveyed by consumers.
Headline Inflation (Consumer Price Index CPI) VS. Core PCE
In the current macroeconomic environment, every new inflation data release is highly scrutinized to gauge how it might influence the Federal Reserve’s and other central bankers on monetary policy. In the US, the two main price indexes used to measure inflation are the Consumer Price Index (CPI), distributed by the Bureau of Labor Statistics, and the Personal Consumption Expenditure (PCE) Price Index, distributed by the Bureau of Economic Analysis. The Federal Reserve’s preferred index is the PCE measure, but it monitors CPI as well.
Aside from the source of the data collected, the factors most affecting these measures fall under ‘weight’ and ‘scope’ with the latter having the largest impact. When looking at weight, the CPI doesn’t update the weight of its components as frequently as the PCE does. For instance, the CPI does annual updates versus the quarterly updates used with PCE. This is one of the reasons that the PCE is favoured over the CPI. Additionally, the Fed favours Core PCE which further limits the scope of the data by excluding variable data such as energy and food which tend to fluctuate the most.
Why is this relevant? The relevance is that when we look at the Core PCE data, it paints a different picture than headline CPI data. For instance, core prices rose just 0.1% in August, while the core 12-month inflation rate eased to 3.9% from 4.2% in July. That latest reading is the lowest since September 2021. The opposite occurred for headline CPI where it pointed to a rising inflation since July.
Earlier last week, the Commerce Department released revisions of GDP and inflation data which show that the recent disinflationary trend has been even more dramatic. On a 3-month annualized basis, core PCE inflation is running just 2.1%, down from 2.7% in July.
Federal Reserve chair Jerome Powell said last week that he wants to see six months of tame inflation data before policymakers will gain confidence in the current trend. We’re not quite there yet, but we could be getting very close. The 6-month annualized core PCE inflation rate eased to 2.9% in August from 3.4% in July.
Survey of Consumers – University of Michigan’s Inflation Expectations
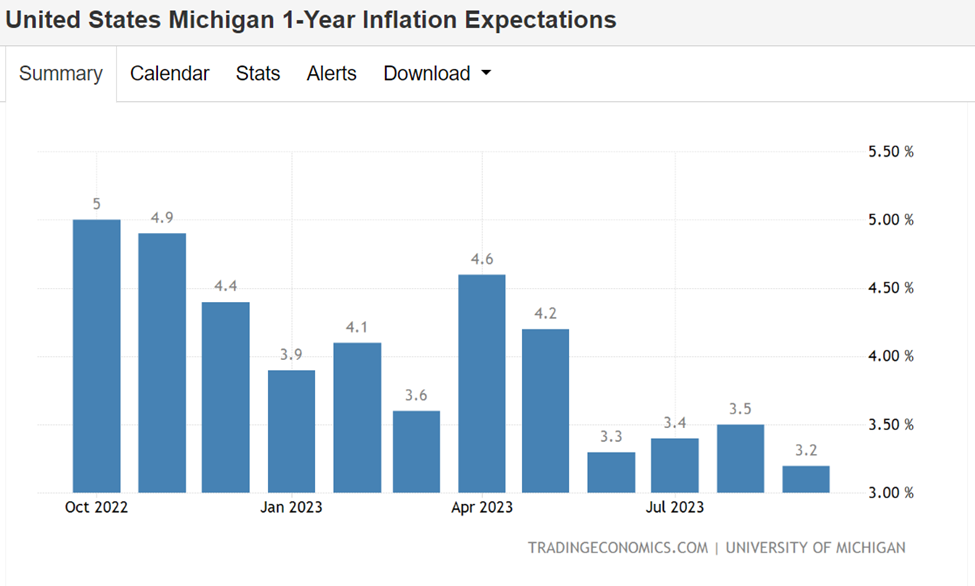
On a brighter side, the University of Michigan on Friday released the results of their latest consumer survey, and it showed a rosier picture for expectation in the coming months. The Surveys of Consumers are conducted by the Survey Research Center at the University of Michigan. Founded in 1946 by George Katona, the surveys have long stressed the important influence of consumer spending and saving decisions in determining the course of the national economy. The Surveys of Consumers have proven to be an accurate indicator of the future course of the national economy. The Index of Consumer Expectations, produced by the Surveys of Consumers, is included in the Leading Indicator Composite Index published by the U.S. Department of Commerce, Bureau of Economic Analysis. The inclusion of data from the Surveys of Consumers by the Commerce Department is a significant confirmation of its capabilities for understanding and forecasting changes in the national economy.
The University of Michigan inflation expectations for the year-ahead in the United States fell to 3.2% in September 2023, the lowest since March 2021, from 3.5% in August. Preliminary figures had pointed to 3.1%.
Since 2000, we can see that we are clearly within the 5-year inflation expectation band while the short term 12-month expectation of inflation is reverting to the mean. This chart and the latest Core PCE data will give some perspective on where we are heading as far as inflation is concerned and perhaps will extend the interest rate pause well into November and beyond. The below chart is obtained from Macro Micro.

The Pinch on the Canadian Consumer
There is no doubt that higher interest rates negatively impact consumers. This impact is felt more by Canadians than Americans due to Canadian consumer lending structure, notably the duration or term on our conventional mortgages. As such, American households are relatively unscathed by higher rates since a small percentage of borrowing will need to renew or refinance their existing mortgages. Here in Canada, there is a high probability that most borrowers will be somewhat negatively impacted by this high-rate environment.
There are clear signs that consumer spending in Canada is cooling down due to higher rates. Let’s have a look at some areas where we see this cooling effect.
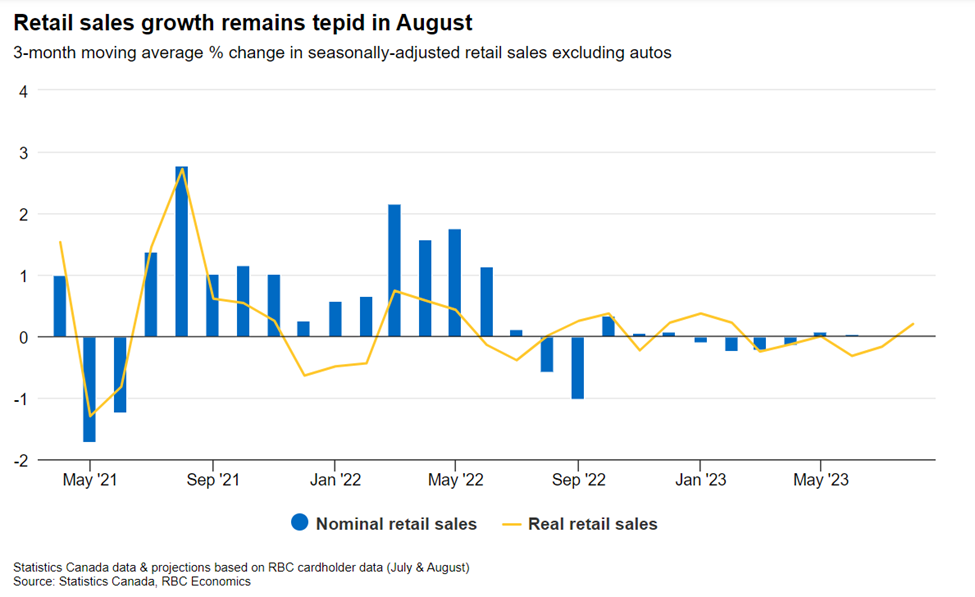
Retail Sales – According to Stats Canada and data collected from RBC, after posting an outright decline in Q2, retail sales growth (excluding autos) has been relatively flat in the first two months of Q3 and is expected to remain tapered going to the end of the year.
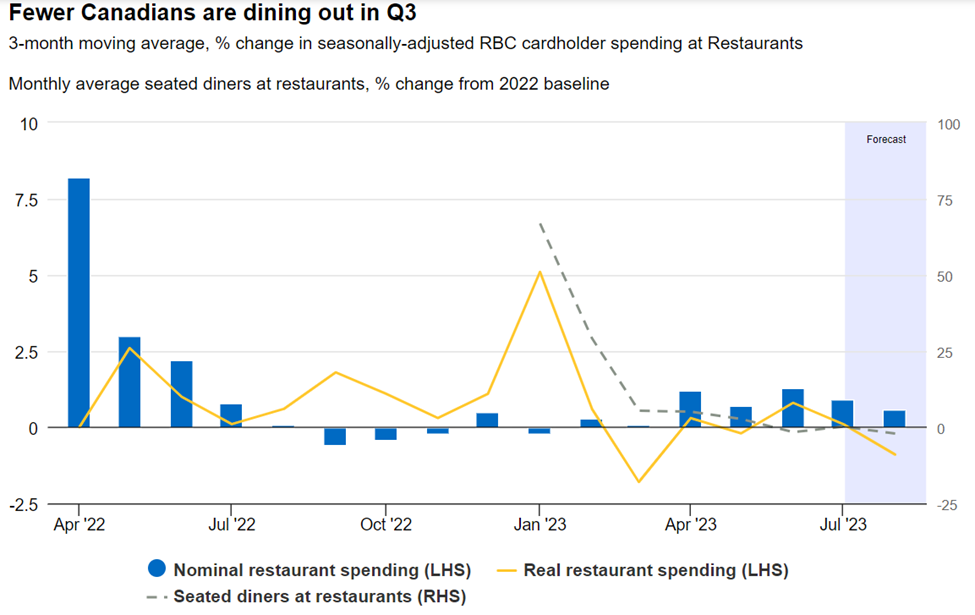
Dining Out – A softening in restaurant spending in Q2 is continuing into Q3. Nominal restaurant spending fell in August as Canadian restaurants seated fewer diners.
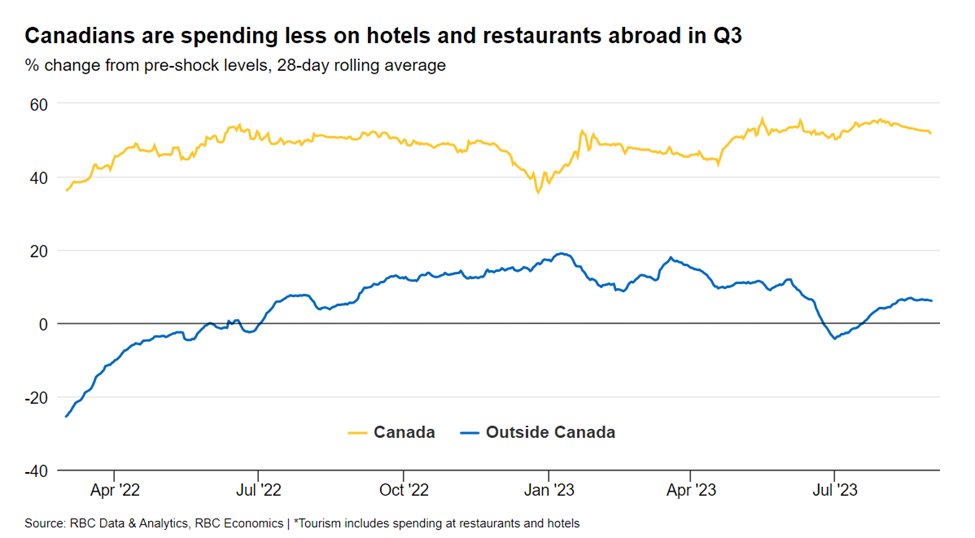
Travelling – Canadians are spending less on hotels and restaurants in Q3 than Q2, signaling that Canadians are beginning to tighten their (travel) belts.
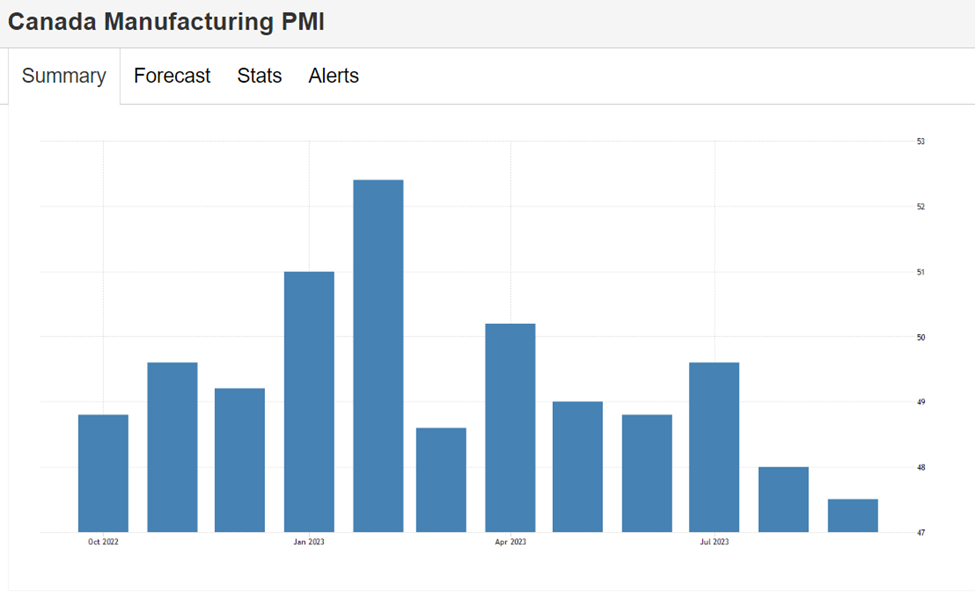
Canadian factory PMI falls to three-year low in September
Fresh off the press, the S&P Global Canada Manufacturing PMI fell to 47.5 in September of 2023 from 48 in the previous month, pointing to the fifth consecutive contraction in Canadian factory activity, and at the sharpest pace since the pandemic-driven crash in the second quarter of 2020. The result suggested that higher interest rates from the Bank of Canada are being transmitted to a larger extent by the end of the third quarter, hampering demand for factory goods. New orders contracted at the sharpest pace since March, both domestically and internationally, as clients waited for lower prices to commit to purchases. Consequently, production sank at the fastest pace in one year, even though backlog levels fell the most in 40 months. Softening market conditions drove manufacturers to cut purchasing activity and staff. (Source & Chart: Trading Economics)
Market Fatigue or Healthy Pullback
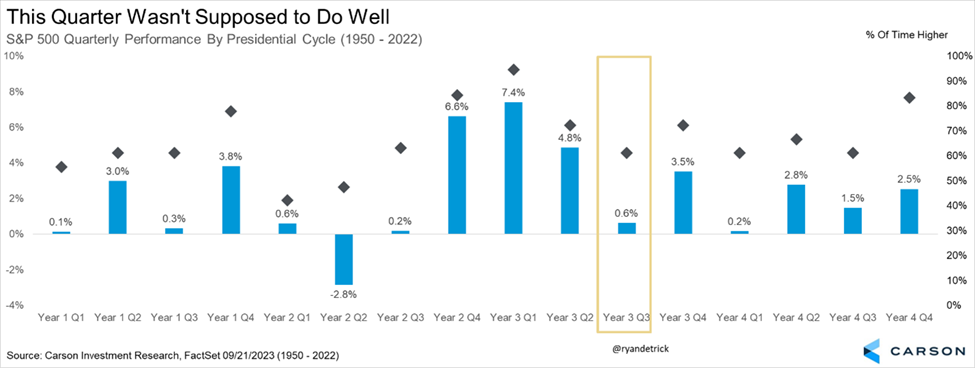
There is no doubt that there is some market fatigue playing into the volatility we’ve seen over the last two months. The uncertainty surrounding interest rates, inflation, and the overall economy has many investors sidelined and less eager to buy equities. But what if this is simply a healthy pull back that reoccurs at this time of the year specially during a pre-election year. Based on some historic data, it may appear that the recent pullback is normal and in line with historic Q3 in a pre-election year. From the data below, Q3 of a pre-election year seems to be the weakest of the quarters in the year. This has come to fruition given the weakness we saw in August and September. Fortunately, historic data plays in our favor with data showing that since 1950, Q4 of a pre-election year shows a gain of 3.5%. (Source: Carson Research)
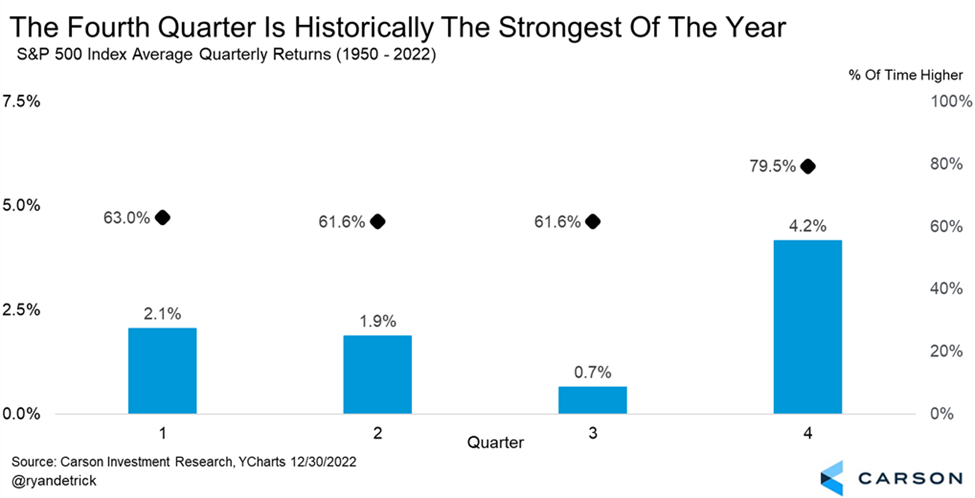
Furthermore, as most investors know, but is important to remember, the fourth quarter is the best quarter of the year, up nearly 80% of the time and up more than four percent on average, twice as much as the next best quarter.
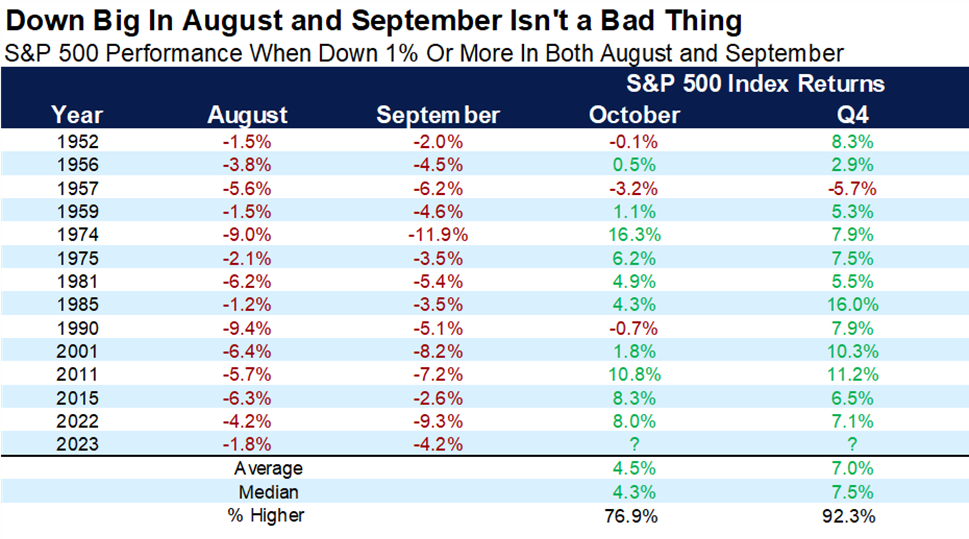
Adding to reasons to look for a rally, when stocks fall more than 1% in both August and September, a big bounce back in October is normal, as is a great fourth quarter. The last three times that happened, October bounced back a very impressive gain of 10.8%, 8.3%, and 8.0%, respectively. Turning to the fourth quarter, it has been up 12 out of 13 times and up more than 7.0% on average. In other words, when we see the seasonal August/September weakness it is also normal to see a strong end-of-year rally.
In Summary
Stocks have pulled back in consecutive months and fear has increased. There is an enormous amount of confusion and uncertainty around inflation and where interest rates are heading. Although the 10-year treasuries and government bonds yields have steadily risen, (due to a higher inflationary environment) the credit spreads haven’t widened signaling a risky environment. We wrote last month that we think that bond spreads could tell us a lot about the health of the economy and so far, they are calm and there are not indicative of any danger. For example, if investors believe a recession is imminent, they may expect lending to companies to be riskier and hence demand higher interest rates. The credit market typically tells us a lot about risk, and so far, they’re not pointing to an imminent threat or high-risk environment.
We believe that we’ve gone though a period of seasonality and a period that historically has been the weakest in pre-election year (Q3), and we should see a much better Q4 as mentioned above. We could see downward pressure on prices if energy prices remain flat or ideally come down gradually. In the meantime, we will continue to buy stocks exhibiting strength and will sell those that fail to do so.
We thank you for your continued trust and we welcome you to reach out to us with any questions you may have.
This information has been prepared by Kian Ghanei who is a Portfolio Manager for iA Private Wealth Inc. and does not necessarily reflect the opinion of iA Private Wealth. The information contained in this newsletter comes from sources we believe reliable, but we cannot guarantee its accuracy or reliability. The opinions expressed are based on an analysis and interpretation dating from the date of publication and are subject to change without notice. Furthermore, they do not constitute an offer or solicitation to buy or sell any of the securities mentioned. The information contained herein may not apply to all types of investors. The [Investment Advisor/Portfolio Manager] can open accounts only in the provinces in which they are registered.
iA Private Wealth Inc. is a member of the Canadian Investor Protection Fund and the Investment Industry Regulatory Organization of Canada. iA Private Wealth is a trademark and business name under which iA Private Wealth Inc. operates.