
We hope that you’ve had an enjoyable August. For many, the last month was unnerving in many aspects. From record heat and wildfires devastating areas in BC and the US, to Trumps’ unscathed popularity amongst the Republican voters despite several indictments, we look to September for some calm. To add insult to injury, the financial markets lost some of their momentum in August as investors became nervous and took some profits off the table in preparation for Jerome Powell’s speech at this year’s Jackson Hole Symposium that took place last week. Let’s look at some of the key drivers shaping the financial markets.
Jackson Hole Symposium
At the end of each summer, dozens of central bankers, policymakers, academics, and economist from around the world gather for three days in Jackson Hole, Wyoming to discuss economic issues, implications, and policy options pertaining to the symposium’s theme for the year. Leading up to this event, investors feared how the markets would react to key takeaways and discussion summarized in Jerome Powell’s speech. Afterall, during last year’s remarks, Jerome Powell described the expected tightening as “pain to households and businesses” and send the Dow down by 500 points and the S&P500 down by 3.4% in one day. Fortunately this time around, there wasn’t a big sell-off in the market, and in fact, the markets have generally ticked higher.
Chair Powell pointed out that although there were some areas of encouragement, they simply need more data to assess if more tightening is required or a rate hold is appropriate. “These uncertainties, both old and new, complicate our task of balancing the risk of tightening monetary policy too much against the risk of tightening too little. Doing too little could allow above-target inflation to become entrenched and ultimately require monetary policy to wring more persistent inflation from the economy at a high cost to employment. Doing too much could also do unnecessary harm to the economy. Furthermore, he also stated that that getting inflation back to the target of 2% is expected to require a period of “below-trend economic growth as well as some softening in labor market conditions.”
Bad news is good news?!
US GDP and Economic Output
We have said before that we are in a time when bad economic news is perceived as good news for investors. Afterall, no one wants more rates hikes in neither Canada or the US and if things don’t slow down, we can expect rates to continue higher.
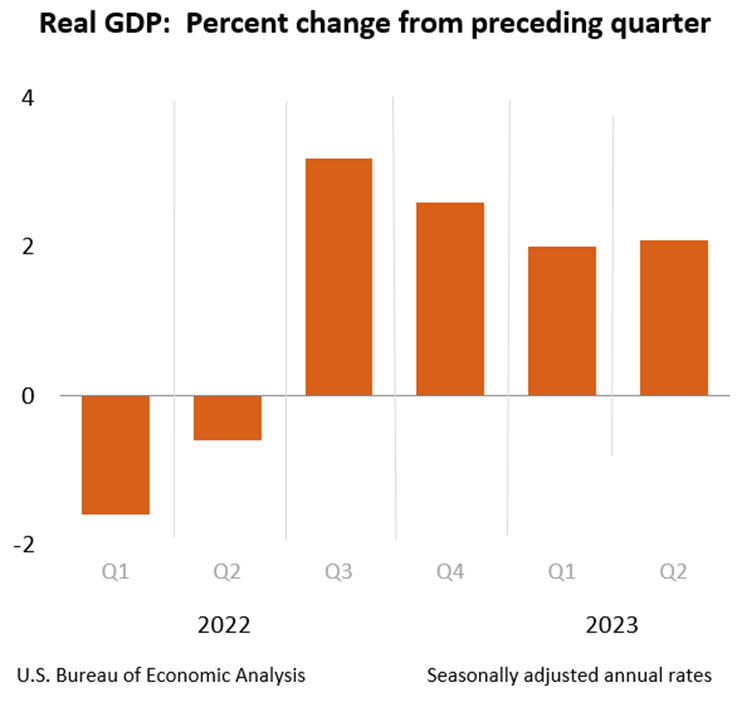
The stock market built some momentum upward this week after revised GDP data showed that the economy grew slower in the last quarter than previously estimated. Although this revised data is lower than the originally projected 2.4% annualized GDP growth, it satisfies the trajectory required by the Federal Reserve to ‘pause’ rate hikes in September as more data is collected and analyzed.
The Labour Market
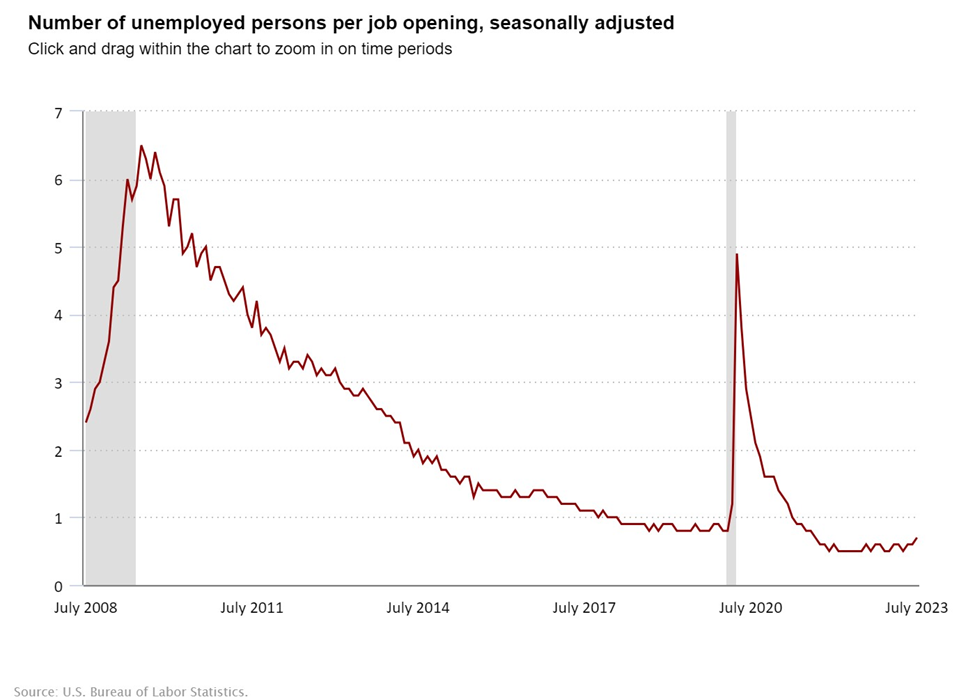
There are signs of a cooling off labour market coming from the US. One of the key labour statistics is what’s referred to as the JOLTS (Job Openings and Labor Turnover Survey). U.S. job openings dropped to their lowest level in more than two years in July, although they remain relatively elevated. This is in no way an indication of a weak labour market, but it does show a path towards a realignment between the supply and demand of the labour markets which could very well tackle the underbelly of the stickiness of the current inflationary environment and reduce consumer spending which accounts for nearly two thirds of GDP. Consumer spending rose by 0.8% in July as consumers continued their pattern of buying good and services during a very busy summer month.
Moreover, and in more job related news, ADP reported less job creation in the private sector for August, further adding to the consensus that US economy might be starting to ease under pressure from higher interest rates. ADP reported Wednesday that private employers added 177,000 jobs in August, well below the revised total of 371,000 added in July. Economists surveyed by Dow Jones were expecting 200,000 jobs added in August.
ADP also reported that pay growth slowed for workers who changed jobs and those who stayed in their current positions.
“This month’s numbers are consistent with the pace of job creation before the pandemic,” Nela Richardson, chief economist at ADP, said in a press release. “After two years of exceptional gains tied to the recovery, we’re moving toward more sustainable growth in pay and employment as the economic effects of the pandemic recede.”
Inflation in Canada
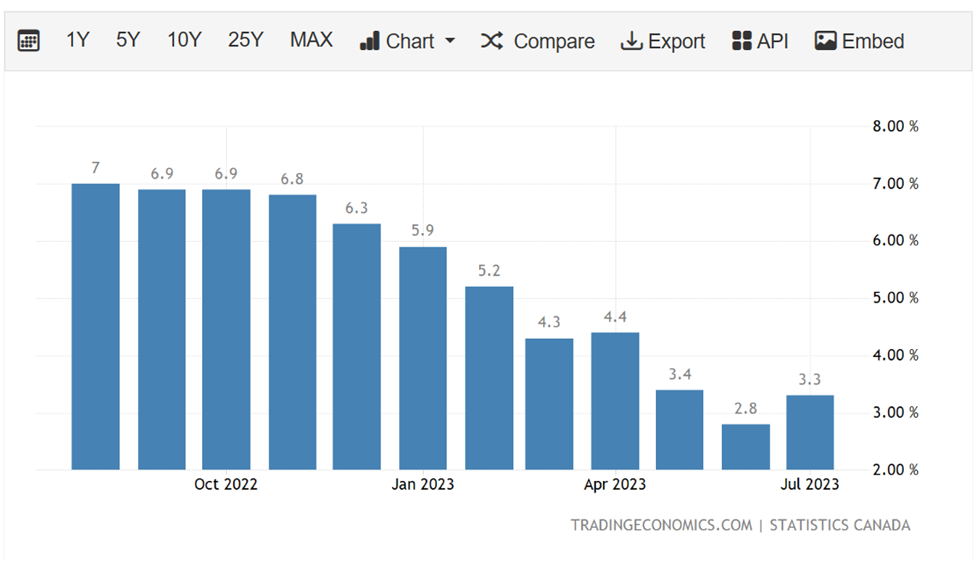
The annual inflation rate in Canada rose to 3.3% in July 2023 from 2.8% in the previous month and above market expectations of 3%. This isn’t encouraging as higher energy prices and housing costs continue to negatively impact inflation data while other items declined over the same period. The Bank of Canada will have a very tough decision come September 6th as they make another interest rate announcement.
Inflation in US
Annual inflation rate in the US accelerated to 3.2% in July 2023 from 3% in June, but below forecasts of 3.3%. It marks a halt in the 12 consecutive months of declines, due to base effects. A year earlier, inflation had started to fall from its peak of 9.1%. Like Canada, energy prices fell less than expected contributing to a bump up in inflation. On the other hand, prices of food, cars, and health services continued to drop.

Historical Data
August started rocky for the stock market but it appears that it has found some support over the last few trading days. We believe that we remain on the trajectory of growth but some bumps in the road are expected. Looking back at some historical data, it appears that the 3rd quarter often is the weakest so its not very surprising to see some volatility around this time of the year.
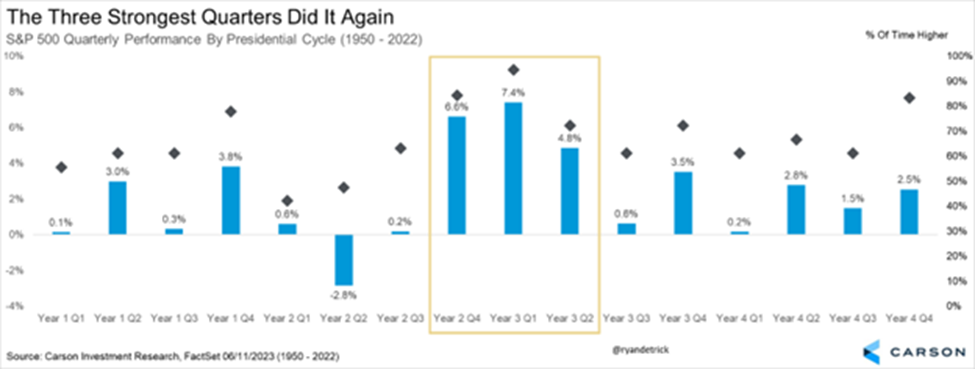
Since 1928, the third year of the presidential cycle has produced positive S&P 500 returns 78% of the time, generating 13.5% average returns. (Source: CFA Institute)
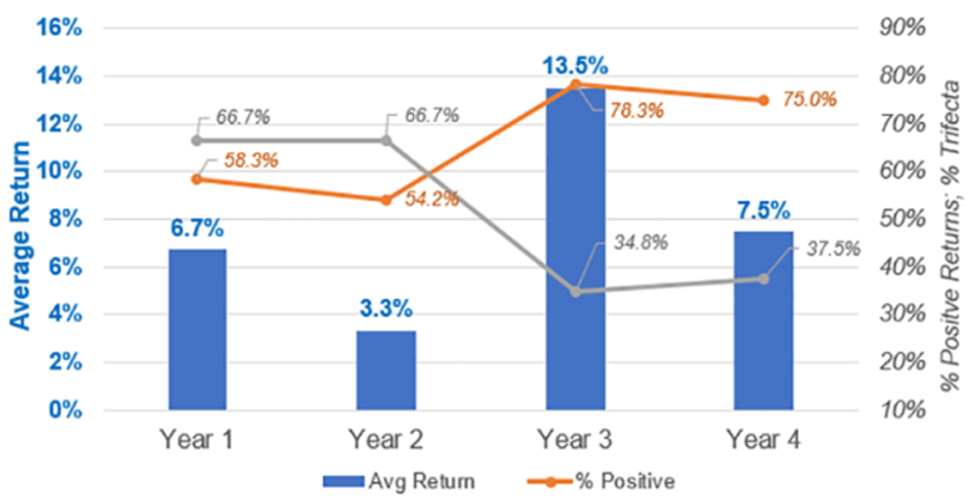
In addition, when you look at those years, as you can see in the chart below, the 3rd quarter of a pre-election year tends to be weak, but it’s followed by a strong 4th quarter. The chart below takes the average returns of the S&P 500 quarterly returns dating back to 1950. On average, the 4th quarter of the pre-election year goes up by 3.5%. (Source: Carson Research)
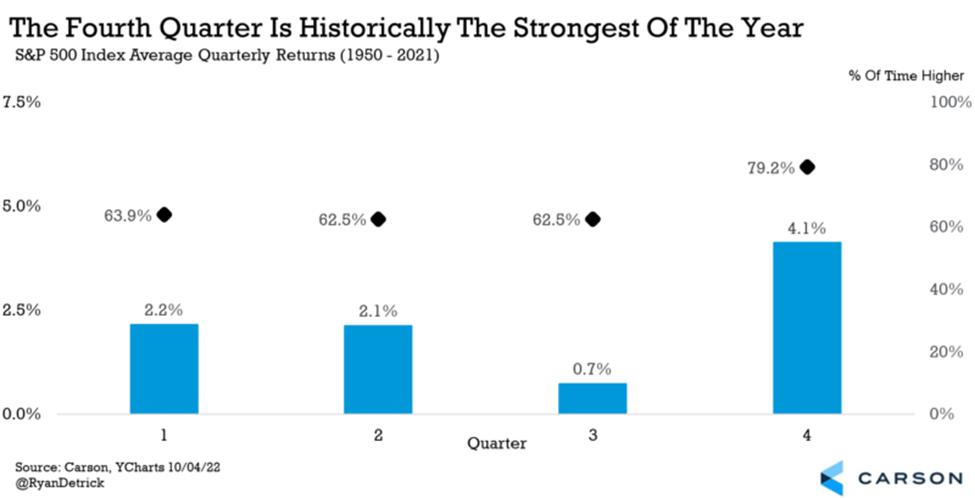
Moreover, the fourth quarter is historically the best quarter of the year, with the S&P 500 up 4.1% on average and nearly 80% of the time. (Source: Carson Research)
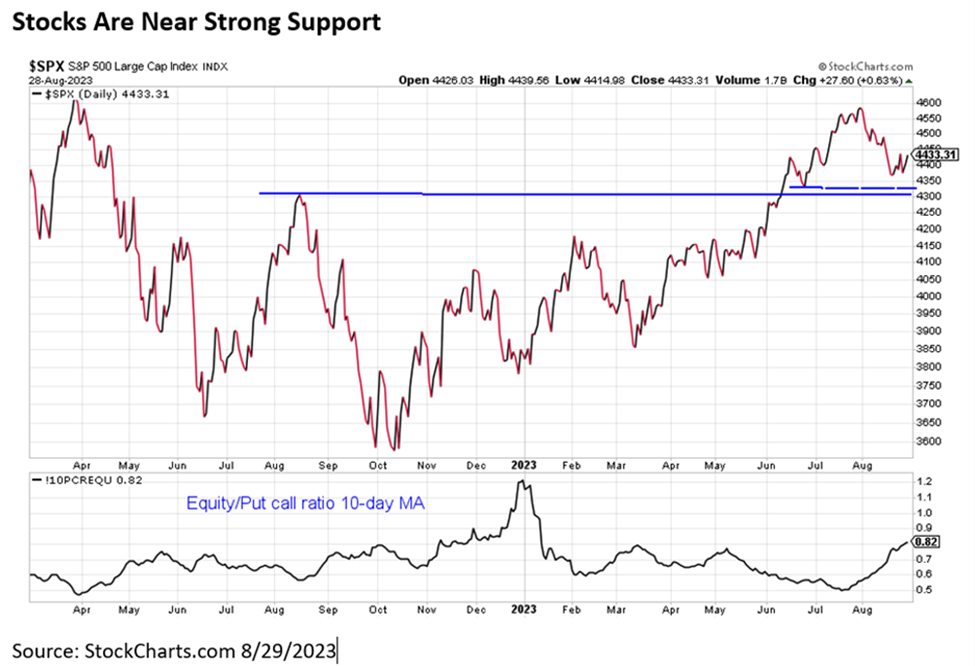
On a technical level, there is very strong price support for the S&P 500 index at the 4328 and 4300 level as seen by the chart below. This chart shows that even with the recent volatility and renewed fears, we expect the equity index to make a bounce back up even with a 4.5% decline in the broader market.
Lastly, credit spreads tell us how much extra interest over Treasury rates investors are demanding from companies that want to borrow money. For example, if investors believe a recession is imminent, they may expect lending to companies to be riskier and hence demand higher interest rates. The credit market typically tells us a lot about risk, and so far, they’re not pointing to an imminent threat or high-risk environment. The chart below shows that during past recessions spreads have soared, but they remain quite tight currently. We think credit markets have some of the smartest investors in the room, and if they aren’t worried, the weakness in the market likely won’t get much worse and may offer an opportunity to add to equities. (Source: Fred.Stlouisfed.org)

In Summary
Stocks have pulled back in August (a little) and fear has increased. With the Jackson Hole symposium out of the way, things have settle down and are finding strong support to move higher in the coming months. The elephant in the room remains to be inflation and interest rate expectations and even though we may have a bumpy ride in the weeks ahead, with credit markets showing very little stress and strong support levels, we don’t expect a major stock meltdown. Instead, we hold our conviction in equities and do expect stocks to make new highs before the year is done.
We thank you for your continued trust and we welcome you to reach out to us with any questions you may have.
This information has been prepared by Kian Ghanei who is a Portfolio Manager for iA Private Wealth Inc. and does not necessarily reflect the opinion of iA Private Wealth. The information contained in this newsletter comes from sources we believe reliable, but we cannot guarantee its accuracy or reliability. The opinions expressed are based on an analysis and interpretation dating from the date of publication and are subject to change without notice. Furthermore, they do not constitute an offer or solicitation to buy or sell any of the securities mentioned. The information contained herein may not apply to all types of investors. The [Investment Advisor/Portfolio Manager] can open accounts only in the provinces in which they are registered.
iA Private Wealth Inc. is a member of the Canadian Investor Protection Fund and the Investment Industry Regulatory Organization of Canada. iA Private Wealth is a trademark and business name under which iA Private Wealth Inc. operates.