
With four months into the year, we feel a shifting sentiment brewing across the financial markets. As fragile as things have been over the last number of quarters, we welcome a positive mood shift in the outlook of financial markets for the remainder of 2023. Of course, the headlines still look awfully worrisome with a consistent barrage of news surrounding Russia, BRICS, Sudan, and recession, but we remain focused on the few market drivers that are dictating financial markets sentiment and direction.
We continue paying close attention to inflation, earnings, consumer spending, and GDP, and so far in 2023, we like the trajectory. Let’s have a closer look at these factors.
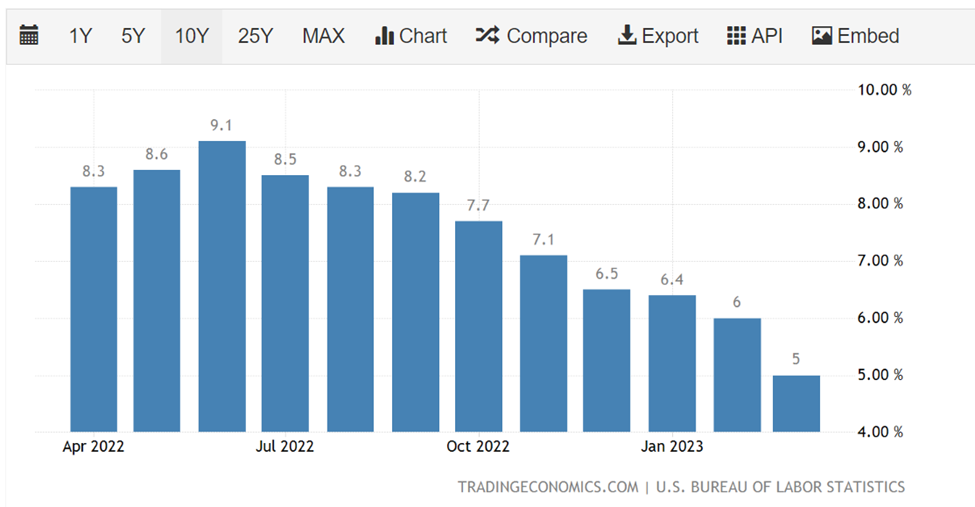
Inflation – US:
The annual inflation rate in the US slowed for a ninth consecutive period to 5% in March of 2023, the lowest since May of 2021 from 6% in February, and below market forecasts of 5.2%. Food prices grew at a slower rate (8.5% vs 9.5% in February) and energy cost fell (-6.4% vs +5.2%), namely gasoline (-17.4%) and fuel oil (-14.2%). At the same time, prices for used cars and trucks declined once again (-11.6% vs -13.6%). Given the current trends as outline above, we believe that the Federal Reserve is inching closer to pausing rate hikes although we anticipate the Fed will most likely increase rates again in May. (Source: Trading Economics)
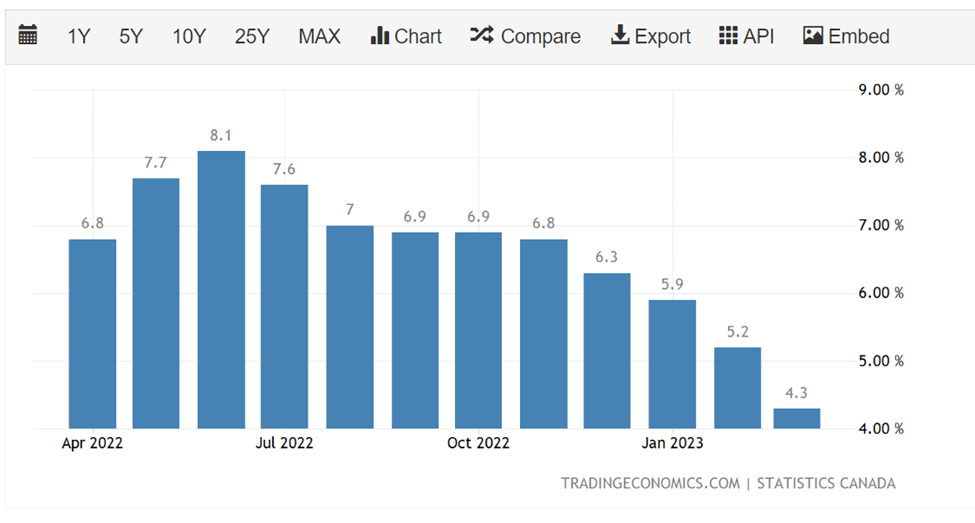
Inflation – Canada:
The annual inflation rate in Canada fell to 4.3% in March of 2023, the lowest since August 2021, in line with market expectations and dropping from 5.2% in the previous month amid significant base-year effects for energy costs. The result was loosely in line with projections from the Bank of Canada following its tightening pause, forecasting that inflation will return to 3% by the third quarter. (Source: Trading Economics)
Corporate Earnings:
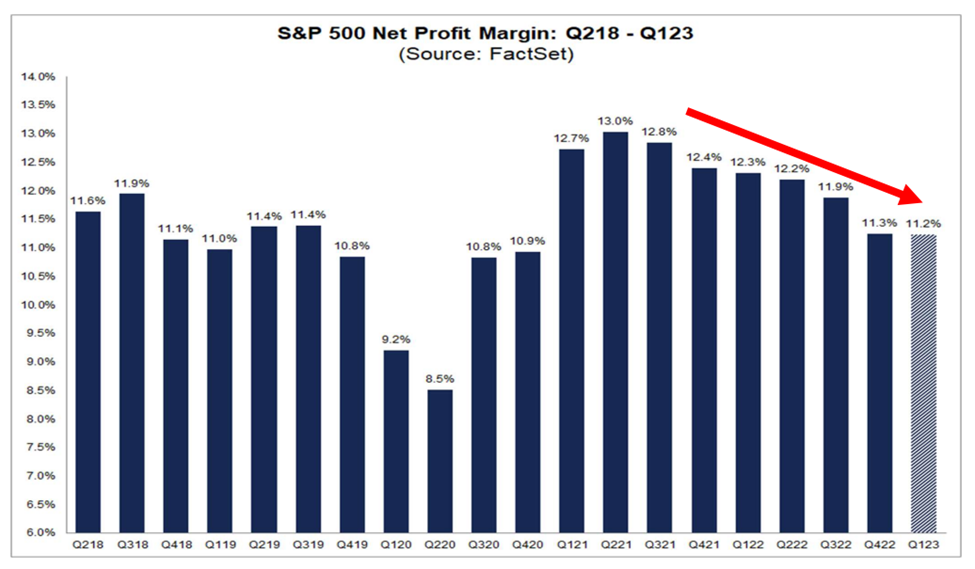
Over the last week or so, the expectations for first-quarter earnings have drastically improved, with analysts projecting a 2.4% year-over-year drop for profits at S&P 500 companies versus the 5.1% decline forecast at the start of the earnings season, according to analyst estimates gathered by Refinitiv. Although corporate earnings continue to shrink, the news isn’t as bad as once projected. Afterall, we’re dealing with a monetary policy environment that is deliberately looking at slowing down the economy and overall consumer and business spending.
Here are some recent S&P 500 estimates and revisions:
- The 23Q1 Y/Y blended earnings growth estimate is -1.9%. If the energy sector is excluded, the growth rate for the index is -3.5%.
- Of the 267 companies in the S&P 500 that have reported earnings to date for 23Q1 77.9% reported above analyst expectations. This compares to a long-term average of 66%.
- The 23Q1 Y/Y blended revenue growth estimate is 2.3%. If the energy sector is excluded, the growth rate for the index is 3.0%.
Furthermore, the tech-heavy Nasdaq led a Wall Street rally that started last Weds when Microsoft issued their Q3 results and quarterly guidance that exceeded analysts’ predictions.
The tech-heavy Nasdaq led a Wall Street rally on Thursday as a strong quarterly report from Facebook parent Meta Platforms Inc overshadowed concerns over slowing U.S. economic growth. Shares in Meta (META.O) closed up 13.9% after touching their highest level in more than a year after the company forecast quarterly revenue above estimates.
The momentum continued Thursday as a strong quarterly report from Facebook parent Meta Platforms Inc overshadowed concerns over slowing U.S. economic growth. Shares in Meta closed up 13.9% after touching their highest level in more than a year after the company forecast quarterly revenue above estimates. (Source: Factset)
GDP – US:
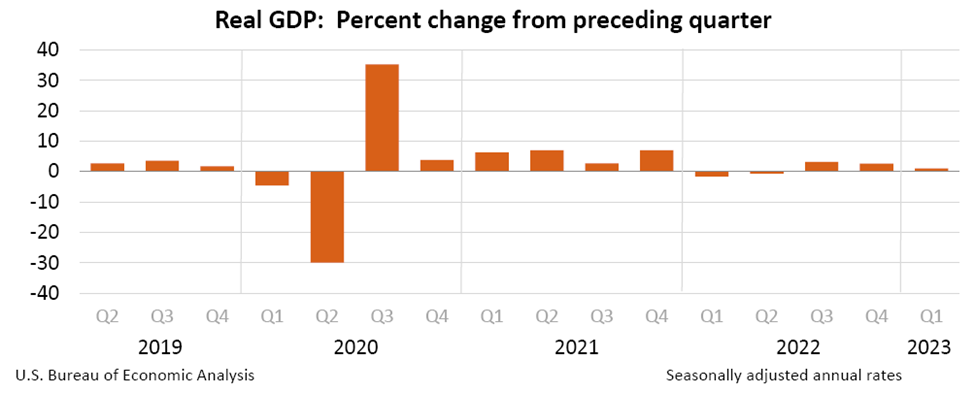
The Bureau of Economic Analysis just reported that the U.S. economy expanded by only an annualized rate of 1.1% in the first quarter. This was well below expectations for 1.9% growth. (Source: US Bureau of Economic Analysis)
– Personal consumption (68% of GDP)
– Business Investment (13%)
– Residential investment, i.e. housing (4%)
– Government spending and investment (18%)
– Net exports, i.e. exports minus imports (-3%)
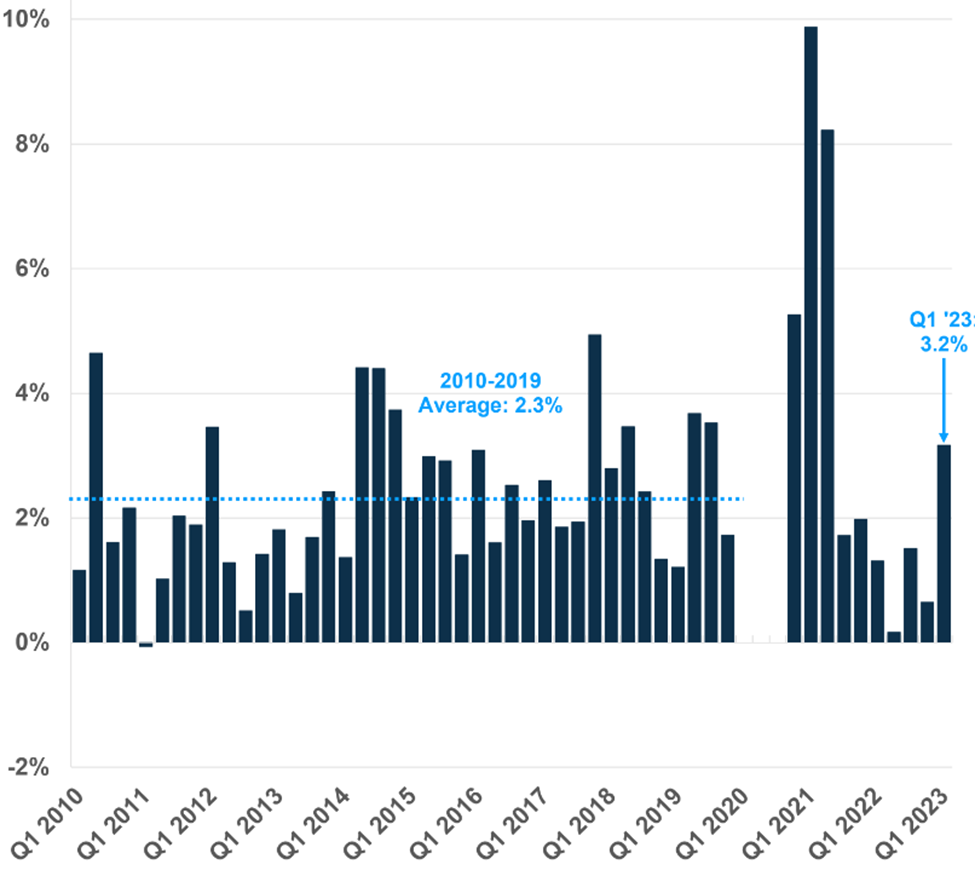
The last two components are extremely volatile and can create significant volatility in the headline data. According to Carson Group, when thinking about economic growth, we want to look at domestic demand, and a good measure for that is “Real final sales to domestic purchasers”, which is simply the sum of the contributions from the top 4 components. If that measure is to be used, we can see that there really wasn’t a slowdown. In fact, domestic demand rose by 3.2% in Q1. That’s the fastest pace of growth since the second quarter of 2021. By the way, the average over the last decade (2010 – 2019) was 2.3%. (Source: Carson Group)
As you may have noticed from the GDP contribution table, domestic demand was boosted by personal consumption, which surged at a 3.7% pace. A lot of this came from a rebound in goods consumption, mostly thanks to increased vehicle purchases. But even services spending, which makes up 45% of the economy, rose 2.3%.
Canada’s GDP
The Canadian economy grew less than expected in February from the previous month and is expected to shrink in March, according to data that back up the central bank’s plans to keep interest rate hikes on hold.
February gross domestic product gained 0.1 percent from January, less than the 0.2 percent increase forecast by analysts, after an upwardly revised 0.6 percent expansion in January, Statistics Canada said on Friday.
The flash estimate for March, which may change when a final tally is released next month, means the economy likely grew 2.5 percent on an annualized basis in the first quarter. The Bank of Canada has forecast a 2.3 percent rise in real GDP in the first quarter.
Against this backdrop, the Bank of Canada is expected to remain on hold, assuming inflation continues to recede. (Source: Statcan)
Our Contrarian Take:
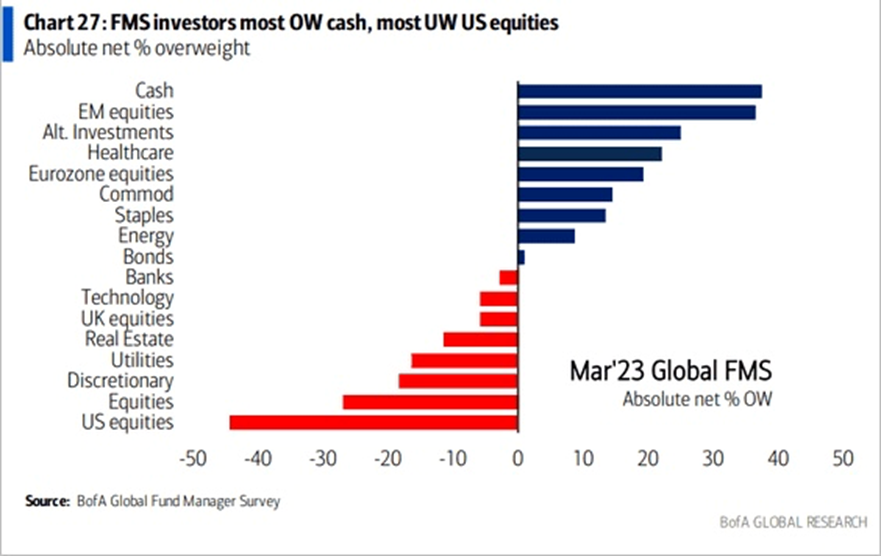
Last month, we briefly discussed the Bank of America’s monthly survey of fund managers. Many money managers have been structuring a defensive stance and generally hold a pessimistic view surrounding equities. This is evident as they have been building up cash and defensive securities while selling US equities. There is undoubtedly a tremendous amount of uncertainty and risk in the markets and that is most certainly feeding the pessimistic views for many money managers. But what if things aren’t as bad as it appears? What if our economies hold up well against a tightening backdrop and experience modest contractions while experiencing a continues downward pressure on inflation? After all, some of the data points we are considering are certainly offering a rosier outlook. With some of the recent earnings beats and overall momentum in the broad indexes, we continue to see this as an opportunity if those managers decide to allocate back into equities. At some point, some of them may need to admit that we may be at the start of another bull market, especially if interest rates are paused and eventually start to come down. (Source: Bank of American)
Summary
There are compelling reasons as to why equities have risen since the beginning of the year. This rise has been against a backdrop of a worrisome regional banking mismanagement that occurred in March which continues to sort itself out. Inflation is coming down, and although the decline may not be as quick as some had hoped, it is trending down on both sides of the border. We anticipate the US to raise rate on last time next month and sit back to see if inflation continues to fall to 4% and eventually below 3%.
Furthermore, we’re surprised by resiliency of corporate earnings in Q1. There are some revisions that have taken place over the last week in light of some impressive earnings beat and guidance by Meta and Microsoft.
The GDP data from the US and Canada have also been better than expected. Keep in mind, we are in a tightening phase of the economy where our central bankers are attempting to slow down our economies, and despite this headwind, the GDP data continues to impress.
The Golden Cross of the S&P 500 that occurred in February still holds true with the 50 day-moving-average holding above its 200 day-moving-average, and we now are looking at this as a level of support heading into April. Despite the recent volatility in March, the S&P 500 remains resilient is continues to make higher lows as its determined to make up some of the losses of 2022.
We thank you for your continued trust and we welcome you to reach out to us with any questions you may have.
As your trusted Portfolio Managers, Terry and Kian, and the Caerus Private Wealth team is available to address any questions you may have.
This information has been prepared by Kian Ghanei who is a Portfolio Manager for iA Private Wealth Inc. and does not necessarily reflect the opinion of iA Private Wealth. The information contained in this newsletter comes from sources we believe reliable, but we cannot guarantee its accuracy or reliability. The opinions expressed are based on an analysis and interpretation dating from the date of publication and are subject to change without notice. Furthermore, they do not constitute an offer or solicitation to buy or sell any of the securities mentioned. The information contained herein may not apply to all types of investors. The [Investment Advisor/Portfolio Manager] can open accounts only in the provinces in which they are registered.
iA Private Wealth Inc. is a member of the Canadian Investor Protection Fund and the Investment Industry Regulatory Organization of Canada. iA Private Wealth is a trademark and business name under which iA Private Wealth Inc. operates.