
Yesterday we found out that the Canadian economy stalled in the fourth quarter of 2022 and in fact declined by 0.1% from November. On surface, this news is not overly positive, but this may be exactly what the Bank of Canada had wished for. Many business owners and consumers may be relieved by a slowing economy as they combat higher costs and interest rates. Canadians with large debts on their balance sheets will breathe a sigh of relief as a cooling economy significantly reduces the probability of near-future rate hikes by the Bank of Canada. The slowdown is cause directly by a lack-luster business spending as well as a deflationary Canadian housing market which will allow Canada to defend its rate pause next week.
In the US, things are a bit different and causing a little nervousness for investors and policy makers. In February, inflation numbers printed for January came out hotter than expected. Inflation rose by 0.5% in January which was more than expected. Broad CPI rose lead by shelter, food, and energy. Adding to the anxiety was the fact that Core CPI, the data point that the Federal Reserve pays close attention to, also rose marginally by 0.2%. Core CPI subtracts factors associated with price changes in shelter, food, and energy and is the one metric that they pay close to as the underlying factors are less seasonal and price sensitive. (Source: US Bureau of Labor Statistics)
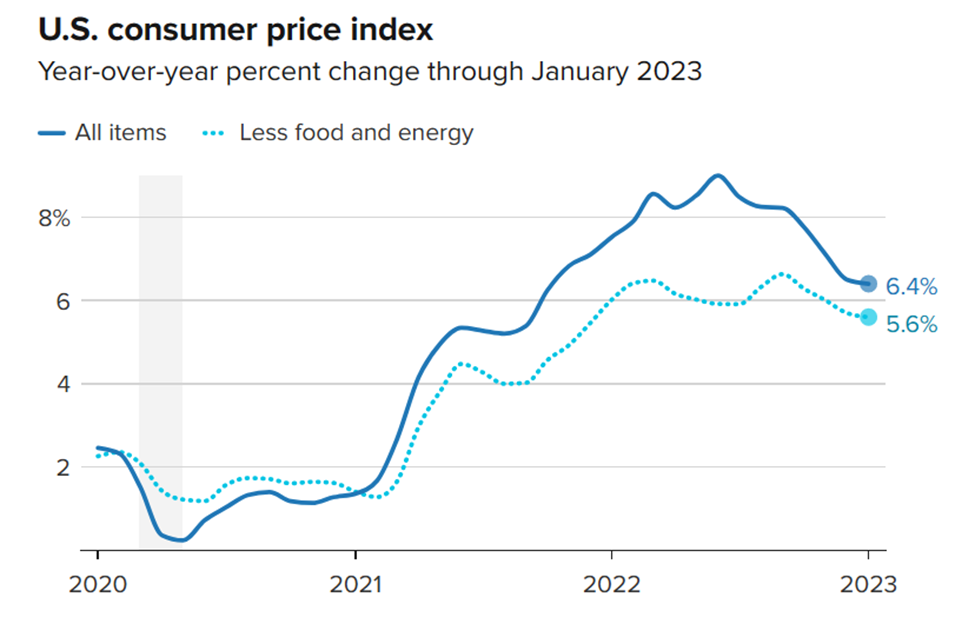
Although the trend in CPI and inflation has been deflationary over the past few months, this latest CPI reading will give the Fed more ammunition and resolve to perhaps continue raising rates 2 or 3 times this year.
Given the heightened probability of more rate hikes in the US, the markets felt some jitters in February but at the same time the markets seem to be holding their support line and seemingly convinced that inflation will continue to get driven down over the course of 2023. Even Treasury Secretary Janet Yellen a spark of optimism in her interview on Monday saying that although “inflation remains too high”, a “soft landing is on the radar”. (Source: CNN)
Soft Landing? The Rumors Are Getting Louder
You may have come across the term soft landing at least a half dozen times over the last few months. This is an important term because it hints at the possibility that the expected recession may be shallow and short-lived. Given the strength in consumer spending and labor market, there is a heightened possibility that we may not encounter a recession at all. Generally, the chances of a recession are increased after a tightening policy cycle which is resemblant of the last year. It certainly felt that way during the last 6 months of 2022. Today, however, there is a renewed optimism and it’s felt across many data points. Although we are not proponents of making predictions off this data; we do, however, rely on it for confirmation, and so far this year, the following data are pointing to a softer landing than previously considered. We will examine data from both sides of the border. (Source: Trading Economics)
Manufacturing PMI
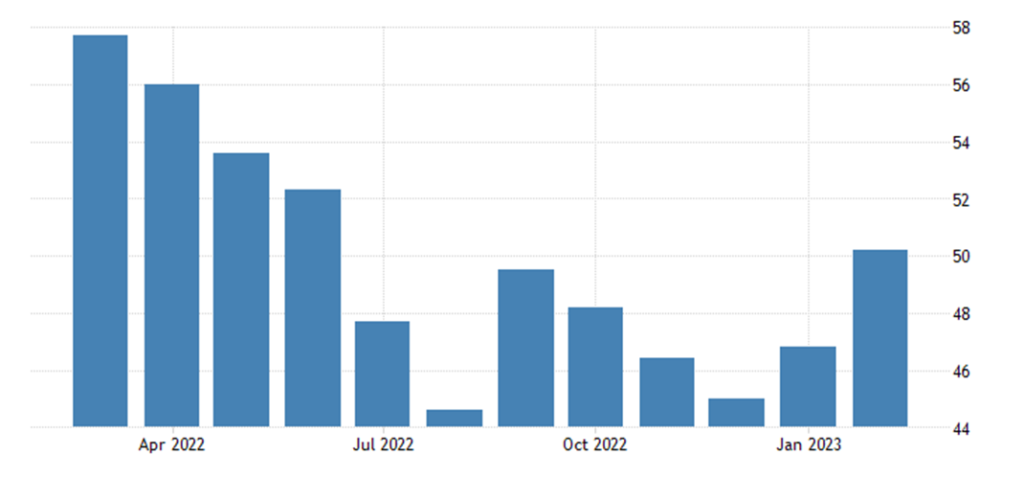
The Purchasing Managers’ Index (PMI) is an index of the prevailing direction of economic trends in the manufacturing and service sectors. It consists of a diffusion index that summarizes whether market conditions, as viewed by purchasing managers, are expanding, staying the same, or contracting. Here we see that over the last few months, the PMI index is rising on both sides of the border.
Figure 1 – Canada PMI
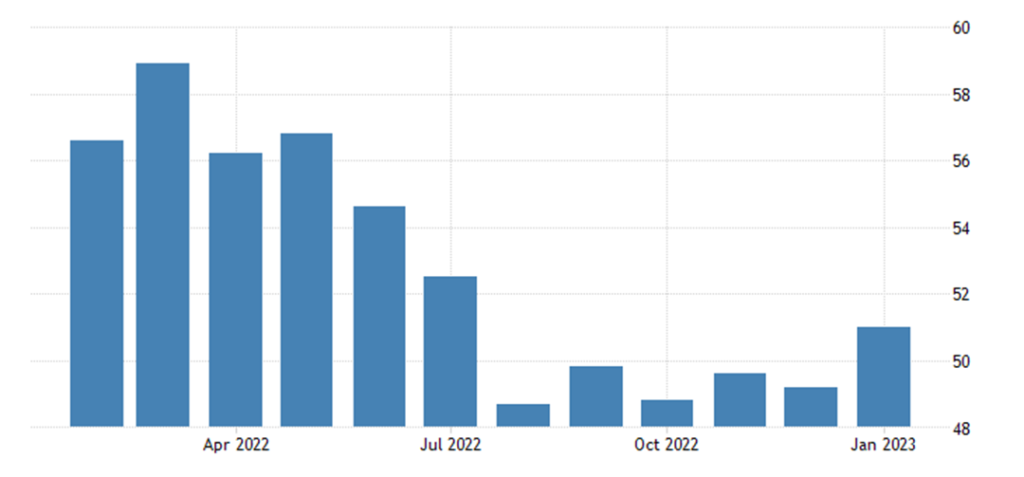
Figure 2 – US PMI
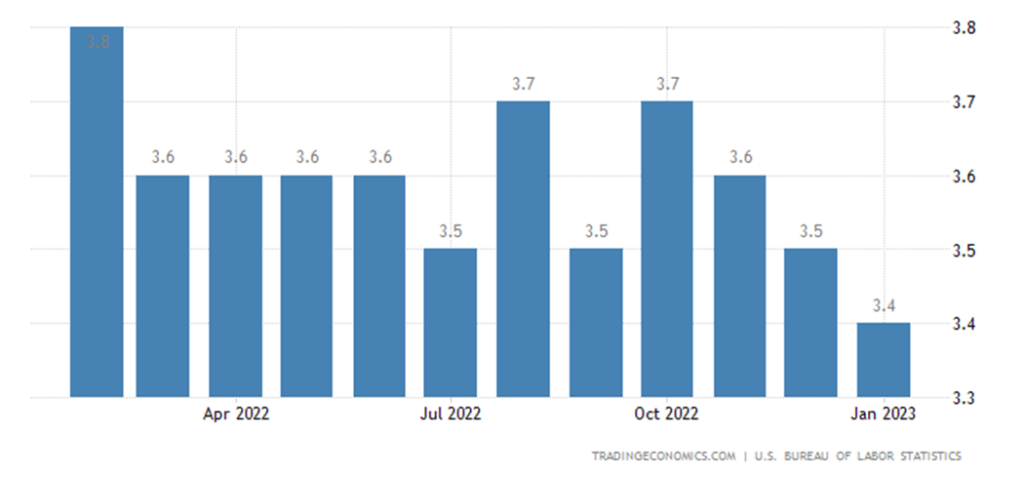
Labor Market
Since a recession is a slowdown in economic activity and labor is a key economic input, it is logical that unemployment would rise as output (what companies make and sell) declines as companies making less and selling less need fewer employees. The charts below are indicating that the labor market is gaining strength and unemployment continues to trend lower on both sides of the border.
Figure 3 – Canada Unemployment Rate
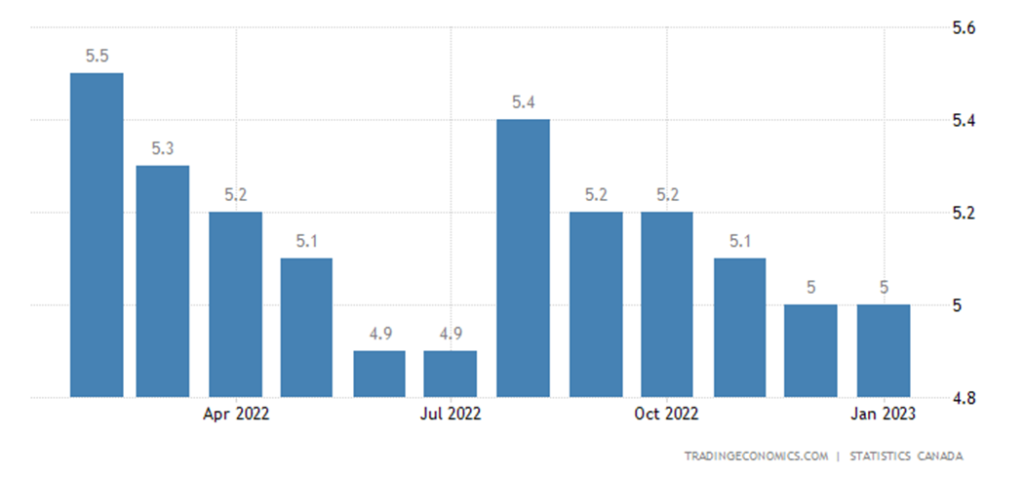
Figure 4 – US Unemployment Rate
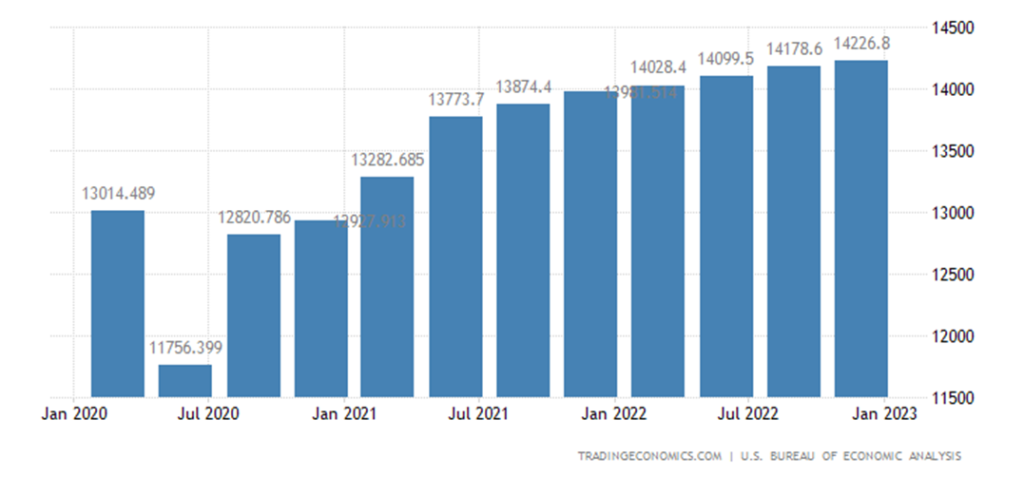
Consumer Spending
Consumer spending accounts for nearly 70% of the total US Gross Domestic Product. The US and its large domestic population play a big part in the direction of the economy and with employment remaining stubbornly tight, consumers continue to spend which lowers the chances of a severe recession.
Figure 5 – Canada Consumer Spending
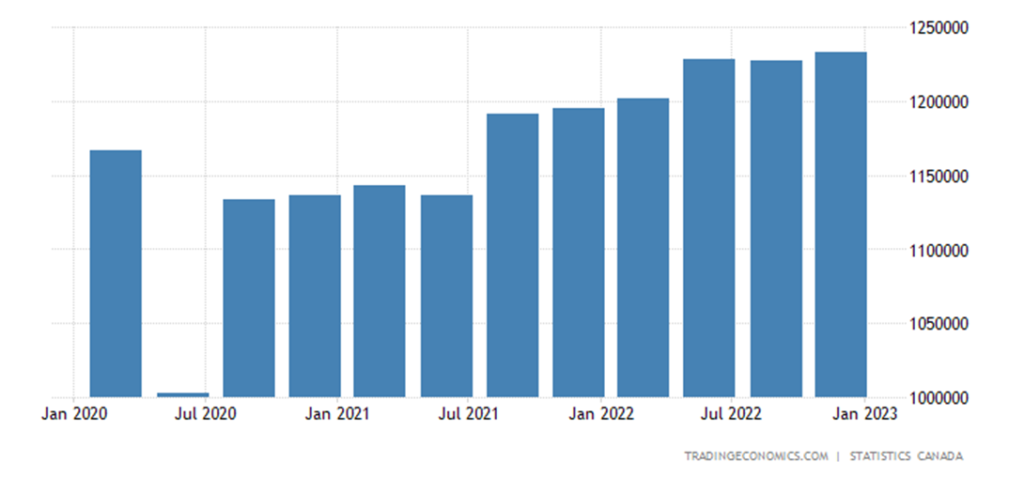
Figure 6 – US Consumer Spending
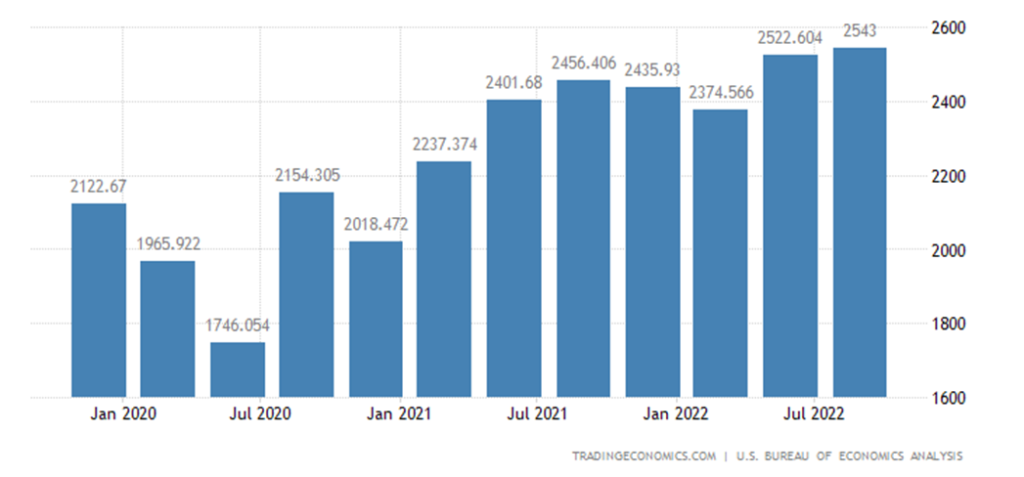
Earnings
In the US, Corporate profits in the United States increased 0.8 percent to USD 2.54 trillion in the third quarter of 2022, following a 6.2 percent gain in the previous period and compared with preliminary estimates of a 0.2 percent drop. Some argue that the earnings are driven by higher costs passed onto consumers. That may be partly true, but the chart below still doesn’t resemble a major slowdown.
Figure 7 – Canada Corporate Profits
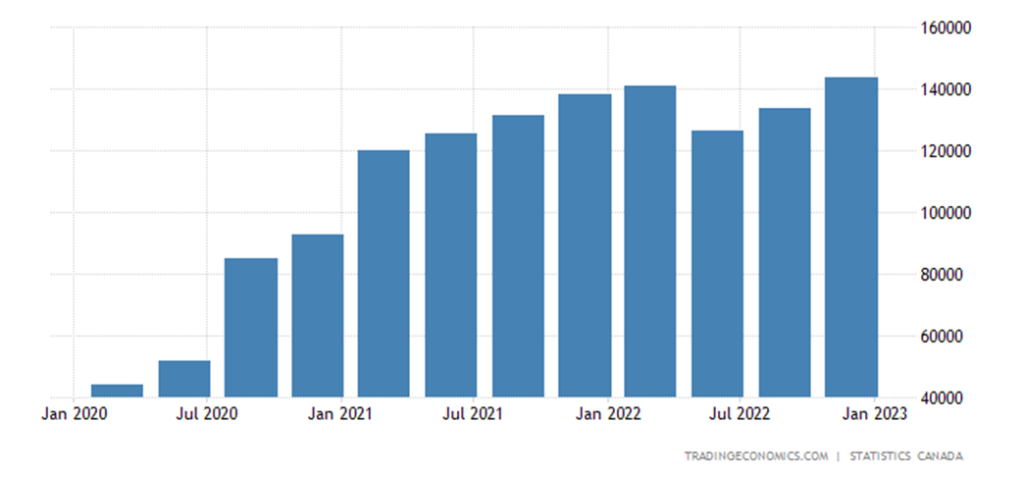
Figure 8 – US Corporate Profits
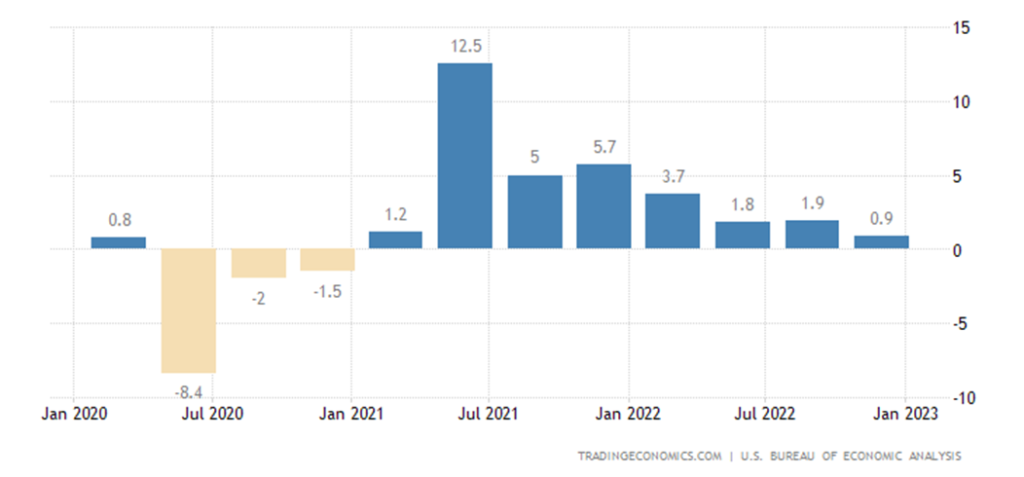
Gross Domestic Product – GDP
While many factors determine if the economy is in recession, the simplest definition used in nearly all economic textbooks defines a recession as two quarters of negative GDP growth. By that measure, the U.S. was in recession in early 2022, yet unemployment continued falling even as economic growth faltered. Although there is an overall cooling down of GDP on both sides of the border, its hard to see a prolonged recession with a tight labor market and consumer spending being where they are currently. Again, we could see these numbers change as higher interest rates take bite and more layoffs are announced. So far, that isn’t the case.
Figure 9 – Canada GDP
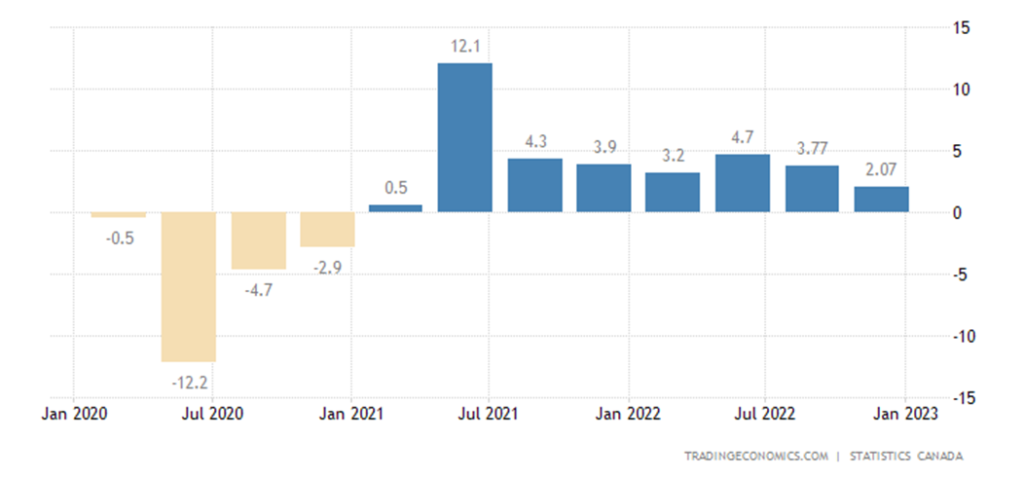
Figure 10 – US GDP
In January we mentioned that we had deployed back into the stock market by using a broad index of S&P’s largest 100 companies. Although there are risks that remain in the financial markets, there were some technical data that we could not ignore. Once of the things we looked at was the Golden Cross which occurs when the 200 day-moving-average price crosses the 50 day-moving-average. This occurs when there is significant momentum to the upside on an aggregate level and there is an overall recovery is asset prices often viewed as a good entry point during a recovery.
Figure 11 – The Golden Cross (S&P 500)
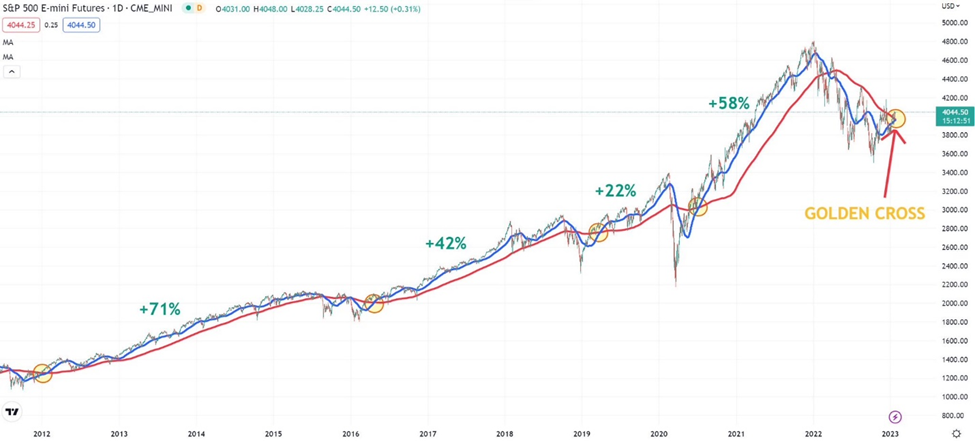
This recent technical development is important as it mirrors the fundamental data finding of a projected soft landing. Although things can change quickly, its nice to know both the fundamental and technical side are projecting similar trends.
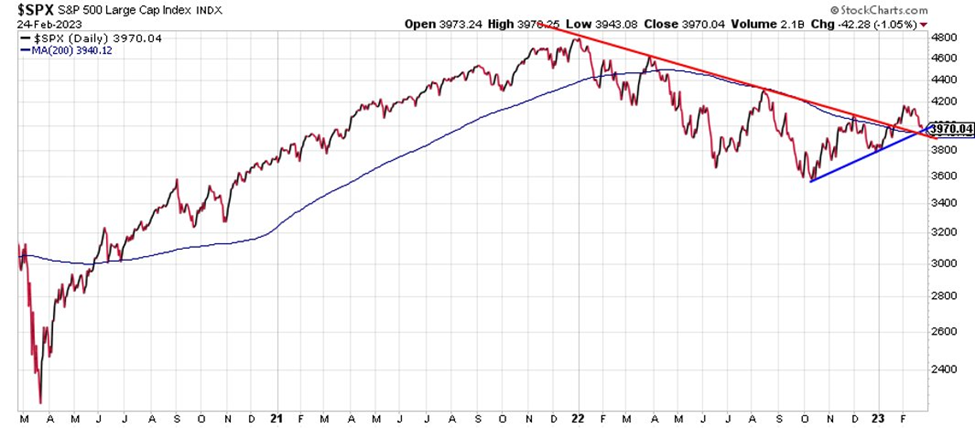
Furthermore, when this cross occurs, it creates a new support level that was close to being tested in February, but it maintained its resilience (red trend line and blue trend line). It’ll be interesting to see how this plays out but for us we hope we see higher lows accompanies by higher highs in the pursuing blue trend line.
Figure 12 – Technical Support Line (S&P 500)
Summary
In Canada, we continue to see some encouraging signs around inflation and expectations are easing around further rate hikes. The US, on the other hand, was met with an unexpected uptick in their January CPI reading which has many thinking at least 2 more rate hikes before they pause. February saw the 10-year US treasury yield play into that narrative as the 10-year treasury increased by over 10% confirming the markets rate hike anticipation staring with the Fed meeting in March.
Aside from the January CPI surprise, the overall trend is still heading in the right direction, and we feel inflation will continue to make its way down throughout 2023. Furthermore, economic indicators such as the labor market, consumer spending, business sentiment, and corporate earnings are painting a more resilience economic picture on both sides of the border and increasing the probability of a soft landing without Canada nor the US incurring a prolonged and deep recession.
In January, we entered the broad stock market with a strategic and staggered approach, and we continue to monitor the technical signals from broad price action. The Golden Cross that occurred last month still holds true with the 50 day-moving-average holding above its 200 day-moving-average, and we now are looking at this as a level of support heading into March.
We thank you for your continued trust and we welcome you to reach out to us with any questions you may have.
As your trusted Portfolio Managers, Terry and Kian, and the Caerus Private Wealth team is available to address any questions you may have.
This information has been prepared by Kian Ghanei who is a Portfolio Manager for iA Private Wealth Inc. and does not necessarily reflect the opinion of iA Private Wealth. The information contained in this newsletter comes from sources we believe reliable, but we cannot guarantee its accuracy or reliability. The opinions expressed are based on an analysis and interpretation dating from the date of publication and are subject to change without notice. Furthermore, they do not constitute an offer or solicitation to buy or sell any of the securities mentioned. The information contained herein may not apply to all types of investors. The [Investment Advisor/Portfolio Manager] can open accounts only in the provinces in which they are registered.
iA Private Wealth Inc. is a member of the Canadian Investor Protection Fund and the Investment Industry Regulatory Organization of Canada. iA Private Wealth is a trademark and business name under which iA Private Wealth Inc. operates.