
Caerus Wealth April Commentary
The last several weeks have proved to be an emotional rollercoaster for many. We have experienced an elevated amount of anxiety, fear, despondence, depression and even anger. Perhaps at times, just sheer boredom. Lately, there seems to be a sense of hope, relief and even optimism surrounding the current crisis as people around the world are impatiently awaiting the resurgence of normalcy. After all, there are compelling statistics showing that the number of Covid-19 cases is on the decline in areas most impacted by the virus with some countries starting to open their economies using a gradual approach. We also share some of those sentiments and hope things get better fast.
April was also a month that saw stock indexes surge from their March lows with the S&P 500, TSX Composite Index and FTSE 100 Index recovering approximately 65% of their losses for the year with each closing down -10%, -13% and -21% respectively year-to-date (Source: Quotestream, April 30, 2020). The recent rally has made everyone wonder if the worst is behind us and whether we are at the beginning of a renewed bull market. Perhaps the bearish sentiment has been overstressed and now it’s time to be adding stocks to the mix. These events have led to an incredibly large divergence between the stock market and the economy which has many pundits puzzled. But is this divergence a short-lived phenomenon and is it a sustainable market rally? At what point will these 2 converge where economic factors play a roll in earnings and the stock market sentiment? The truth is that nobody really knows for sure how things will play out. All we can do, similar to the past, is to take a hard look at the data for some guidance, consumer spending appears to be the most compelling. US weekly unemployment, lower GDP forecasts, and an astronomical rise in government debt. Let’s look deeper into these factors using data collection from our neighbours down south. After all, they are a key component of the global economy and the stock market.
Consumer Spending
In March, consumer spending in the US fell by 7.5% which the Commerce Department said was the sharpest decline going back to 1959. This matters for 2 reasons. One, the stay-at-home protocol was introduced halfway through March. We could reasonably anticipate another decline in consumer spending in April. Two, consumer spending is the key driver for the economy, and it paves the way for job creation and GDP growth. With a shift or decline in consumer spending, things can deteriorate.
USA Unemployment Claims
Unemployment numbers in the US have surpassed 30 million over the last 5 weeks with many of these claims being denied or delayed. Although some of these claims may be for seasonal employees, it speaks to the magnitude of the situation and shines a light on the negative implications of the lockdown. It is not surprising to see the calls by so many people around the world for the reopening of the economy. We expect these numbers to creep higher over the next few weeks before they start going down as more people return to work. Still, we could see a significant portion of them to remain unemployed for a long period of time which could further add to the consumer spending trends mentioned above.
Gross Domestic Product (GDP)
U.S. GDP projections have been widely ranging from mildly pessimistic to very dire. The reality will most likely be somewhere in between. The Congressional Budget Office posted a report on April 24th, 2020 which stated that US GDP is expected to fall by approximately 40% (annualized) in the second quarter this year and approximately 5.6% for the year. This would be the worst decline since 1931, during the Great Depression, when GDP fell 6.5%. (Source: Forbes, As of April 30, 2020) Interestingly the S&P 500 was down approximately 47% that year. (Source: DJ Market Data Group, as of April 30, 2020)
National Debt
With the unprecedented government financial aid and assistance over the last 6 weeks, the current debt level in the US has risen to nearly $25 Trillion, the Debt to GDP ratio is currently sitting at approximately 135% which is significantly higher than most developed countries including Canada which is projected to top approximately 38% by 2021 (Source: Financial Post, April 30, 2020).
Why is this important?
Higher national debt will handcuff the government in the future. Hindering aid for unforeseen future emergencies such as the one we just experienced. With interest rates at near all-time lows and US government debt at all-time highs, there is less in the government arsenal to combat future risks either posed by a resurgence of the virus or another threat. This is most evident if we simply assess the impact of the current government financial support on the recent stock market rally. Without their support, stocks would probably not have experienced the bounce back over the last 3 weeks.
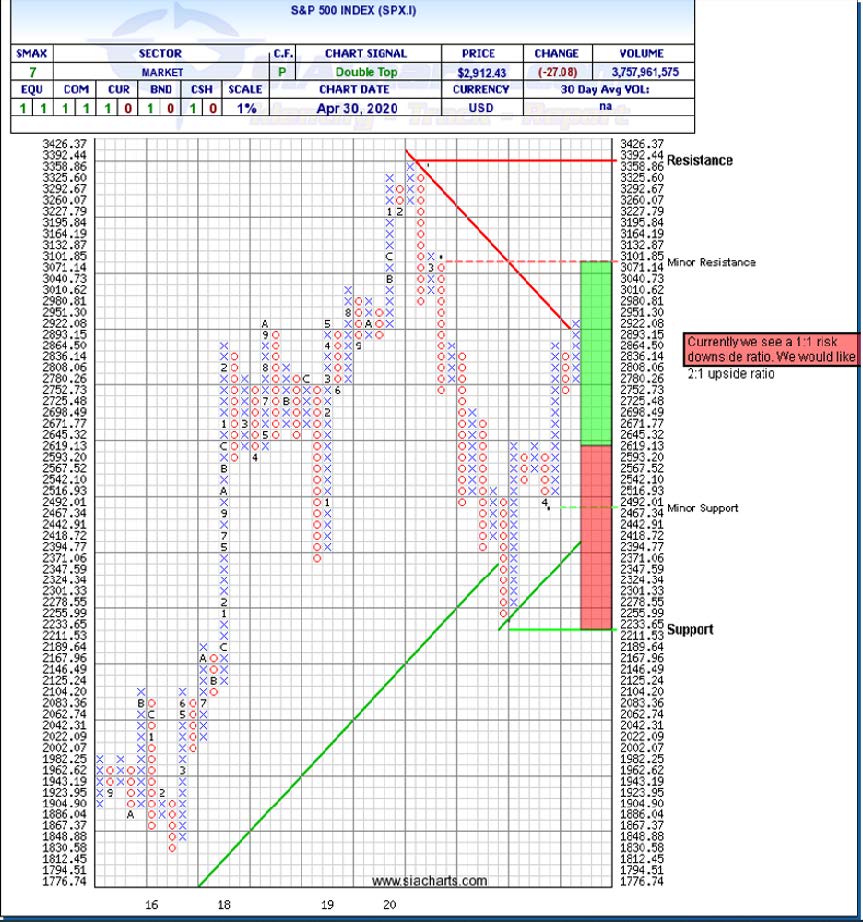
The Technical Argument
The recent drop back toward the 2018 lows (which were briefly broken) and then rebound suggests that a large Head and Shoulders Top may be forming in the S&P 500. The chart at left shows that the left shoulder may have formed at the beginning of 2018 near 2,950 with the recent peak near 3,400 forming the head of the pattern. The two pullbacks in October to December of 2018 and February to March of 2020 have established a neckline in the 2,300 – 2,400 area. Resistance on the S&P500 is at 3101. If resistance is met, the market could decline to current support levels at 2255, and subsequently if it breaks below 2255, the next support level is 2105. We would like to see at least a 2:1 reward scenario on the upside but currently the risk reward is 1:1.
Caerus Private Wealth Portfolios
New Opportunities in an uncertain time
Over the last 3 weeks, we have been working closely with the Bank of Montreal in creating two structured notes exclusively for Caerus clients. We are pleased to announce that we have finalized these two issues and will be looking at allocating them over the next 2 weeks. On a strategic basis, we will be allocating up to 12% across each household. We will distribute more information next week on each of their structures and the opportunity they provide. These structured banknotes are unique in that they provide a superior level of downside risk protection with an attractive expected return. Here is a snapshot of what each series will offer.
Caerus Booster Note: Canadian Banks, Downside Protection 30%, Upside Potential > 55%, 5 YR
Objective
To achieve a return of over 55% over a five-year period holding a basket of the 4 Canadian Banks equally weighted. (Bank of Nova Scotia, Royal Bank, CIBC, and TD referred to as the ‘Reference Portfolio’).
Reference Portfolio
The Reference Portfolio is comprised of the stock valuation of the mentioned four Canadian Banks (Royal, TD, CIBC and Scotia) on the close of May 11, 2020. Currently these 4 Stocks are trading approx. 20% lower year-to-date which provides a better opportunity for the note to pay off.
Valuation Date
The starting valuation date of the Reference Portfolio is on May 11, 2020.
Maturity Date
The maturity date of this note is used to assess the gains/losses derived from this note. This Date is on May 12, 2025.
Criteria for Gains
If the Reference Portfolio finishes higher than 70% of the original value (initially 100%), this note will pay 55% of the original investment which works out to be 9.15% compounded annually. If the Reference Portfolio basket gains more than 55%, any excess gain is multiplied by 2 and added to the 55% booster gain. For example, if the Reference Portfolio gains 70%, the note would pay 85% or 13% compounded annually.
Criteria for Losses
If the Reference Portfolio finishes below 70% of the original value (initially 100%), this note will pay out the fair market value of the Reference Portfolio. For example, if the Reference Portfolio is trading at $69 of the original value of $100 after 5 years, the note would pay out the $69 and we would experience a loss of 31%.
Caerus Coupon Note: Canadian Banks, Downside Protection 40%, 8.5% Annual Coupon, 7 YR
Objective
To receive an annual coupon of 8.5% over a seven-year period by building indirect exposure to a basket of 4 Canadian Banks including Bank of Nova Scotia, Royal Bank, CIBC, and TD referred to as the ‘Reference Portfolio’.
Coupon Payments
Coupon payments are made semi-annually on coupon dates starting with Nov 12th, 2020. Each coupon payment will be for 4.25% of the original investment and is paid 2 times a year for an annual rate of 8.5%.
Reference Portfolio
The Reference Portfolio is comprised of the stock valuation of the mentioned four Canadian Banks equally weighted (Royal, TD, CIBC and Scotia) on the close of May 11, 2020. Currently, these 4 Stocks are trading approx. 20% lower year-to-date which provides a better opportunity for the note to pay off.
Valuation Date
The starting valuation date of the Reference Portfolio is on May 11, 2020.
Coupon Valuation Dates
Coupon Valuation Dates are before each scheduled semi-annual coupon payment to assess the value of the Reference Portfolio.
Maturity Date
The maturity date of this note is used to assess the gains/losses derived from this note. This Date is on May 12, 2027.
Criteria for Coupon Payments
If the Reference Portfolio finish above 60% of the original value (initially 100%), this note will pay the semi-annual coupon payment of 4.25% starting on Nov 12, 2020. It will continue to pay coupons every 6 months if the Reference Portfolio is above 60% on each of the coupon valuation dates. If the Reference Portfolio is trading below 60% of the original value of the Reference Basket, no coupon payment will be made for that period. But if the Reference Portfolio trades higher again above the 60% mark on the next coupon valuation date, coupons will resume.
Return of Principle
100% of the principle will be returned after 7 years if the Reference Portfolio closes above 60%.
Criteria for Losses
If the Reference Portfolio finishes below 60% of the original value (initially 100%), this note will pay out the fair market value of the Reference Portfolio. For example, if the Reference Portfolio is trading at $59 of the original value of $100 after 7 years, the note would pay out the $59 and we would experience a loss of 41%. The losses will be offset by any coupons made during the 7-year term.
In Conclusion
We will continue to remain defensive and will look for signs of solid footing before allocating back into equities. Although we are hopeful that we are making progress with the virus, we feel that the markets will experience some resistance over the next several weeks as more data surfaces around Covid-19’s economic impact. We will continue to seek and add investments that offer an acceptable risk/reward opportunity for us while remaining patient. We welcome any questions you may have.
Important Message
- If you have taken a defensive stance, as we have, we would encourage you to avoid getting caught in the recent rally (bear trap). Be patient and be prepared to give up some gains in the coming weeks.
- If you have not changed your allocation over the last few months, we would encourage you to hedge your portfolio by trimming your equity positions.
As your trusted Portfolio Managers, Caerus Private Wealth and its team are available to address any questions you may have. Stay safe!
Terry Fay, Director, Private Client Group, Portfolio Manager
Kian Ghanei, Director, Private Client Group, Portfolio Manager
Caerus Private Wealth – HollisWealth, a division of Industrial Alliance Securities Inc.
700 – 609 Granville Street, Vancouver BC V7Y 1G5
T: 604.895.3316 | TF: 1800.665.2030 | F: 604.682.0529
terry@caeruswealth.ca | kian@caeruswealth.ca
holliswealth.com | caeruswealth.ca
This information has been prepared by Terry Fay and Kian Ghanei who are Portfolio Managers for HollisWealth® and does not necessarily reflect the opinion of HollisWealth. The information contained in this newsletter comes from sources we believe reliable, but we cannot guarantee its accuracy or reliability. The opinions expressed are based on an analysis and interpretation dating from the date of publication and are subject to change without notice. Furthermore, they do not constitute an offer or solicitation to buy or sell any of the securities mentioned. The information contained herein may not apply to all types of investors. Terry Fay and Kian Ghanei can open accounts only in provinces in which they are registered. HollisWealth® is a division of Industrial Alliance Securities Inc., a member of the Canadian Investor Protection Fund and the Investment Industry Regulatory Organization of Canada.